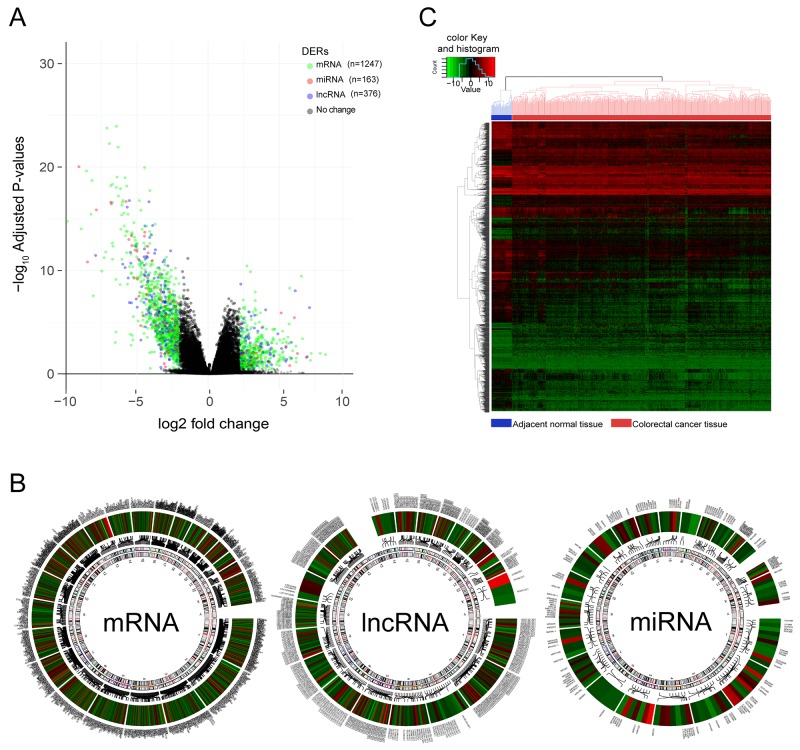
Figure 2. Differentially expressed RNAs(DERs) in colorectal cancer vs adjacent normal tissues.
(A) Volcano Plot visualizing the DERs which was screened by both limma and edgeR. The colorized points in scatter plot represent the DERs with statistical significance (adj.P.Value<0.05, |logFC|>2). Green, red and blue point represent mRNA, miRNA, lncRNA respectively. (B) The distribution and variation trend of each DERs on chromosomes was shown in Circos plots. Color gradient from red to blue represent the logFC of DERs, the gene symbol of each DERs was displayed in outermost region and been pointed to a specific location on chromosome by a connecting line. (C) Two-way hierarchical clustering of 498 tumour tissues and 50 adjacent normal mucosa with the 2114 differentially expressed RNAs using Euclidean distance and average linkage clustering. Every row represents an individual gene, and each column represents an individual sample. color gradient from green to red indicate expression levels from low to high on a normalized value(-10 to 10). The clustering of samples were mainly divided into two major clusters, one was the normal tissue samples and the other was cancer tissue samples.

