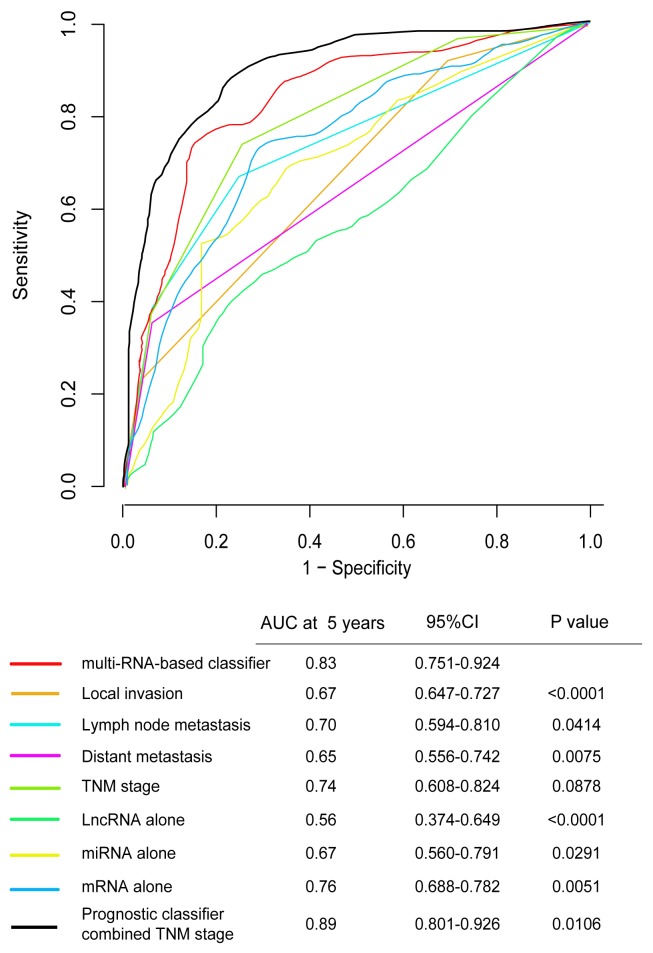
Figure 5. Time-dependent ROC curves compare the prognostic accuracy among the prognostic classifier, clinicopathological features and mRNA, miRNA, lncRNA alone in 598 patients.
Local invasion(T1-T4), lymph node metastasis(N0-N2), distant metastasis(M0-M1), TNM stage(I-IV), prognostic Score(risk score). Only lncRNA (HOTAIR), only mRNA (FAM132B, CPB1, NXPH4, OSR1, PCOLCE2, RNF112, TNNT2, GABRD, MMP1, MS4A1, IZUMO2, GIF), only miRNA (MIR27A). The 95%CI of AUC were calculated from 1000 bootstrap of the survival data. p values show the AUC at 5 years for multi-RNA-based classifier vs the AUC at 5 years for other features. ROC, receiver operator characteristic. AUC, area under curve.

