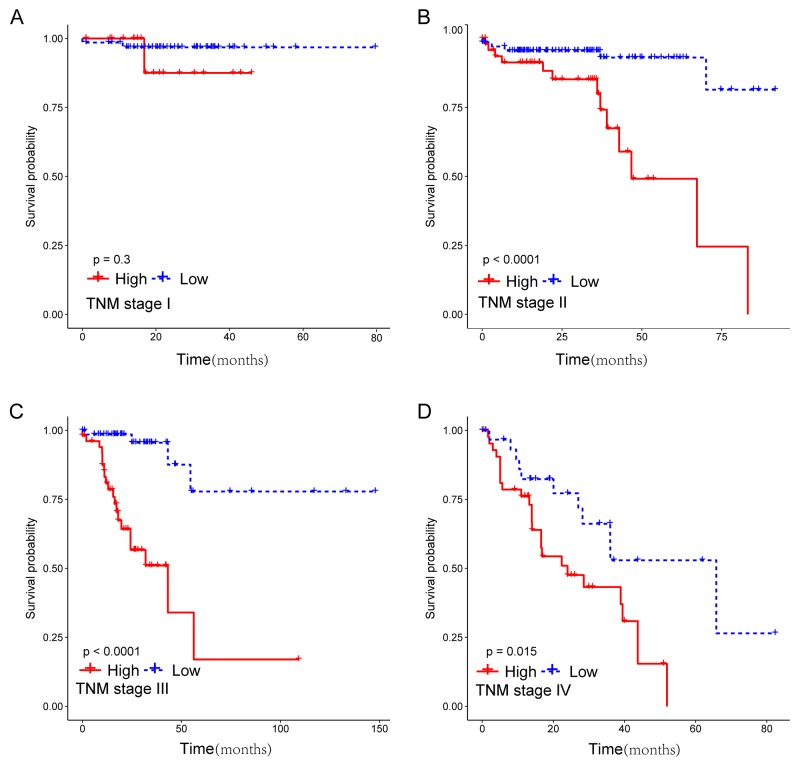
Figure 6. Kaplan-Meier survival analysis for 633 patients according to the prognostic classifier stratified by TNM stage.
Patients were stratified based on TNM stage (stage I, stage II, stage III and stage IV), and then Kaplan–Meier plots were used to visualize the survival probabilities for the low-risk versus high-risk group. (A) Kaplan–Meier curves for stage I (N=122); (B) Kaplan–Meier curves for stage II (N=250); (C) Kaplan–Meier curves for stage III (N=162); (D) Kaplan–Meier curves for stage IV (N=99).

