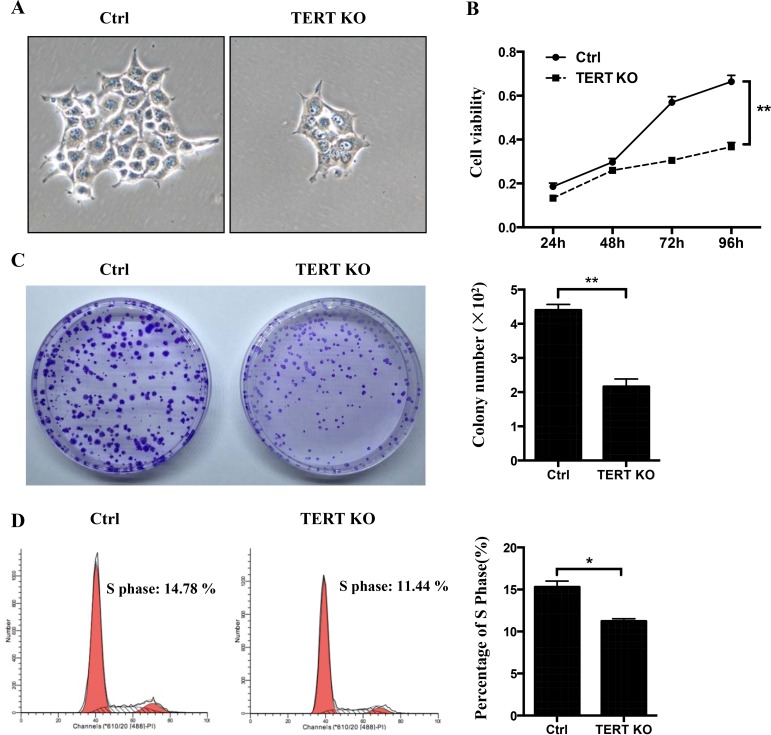
Figure 3. The effects of hTERT on the cell growth in SCC-15 cells.
(A) Morphological changes between the scramble cells and hTERT−/− cells. (B) CCK8 assays were used to determine the cell viability after treatment of the hTERT−/− cells. (C) The clone numbers of SCC-15 compared with the hTERT−/− cells. Representative pictures (left panel) and a summary graph (right panel) are shown (n = 3).(D) Effects of knockout of hTERT on cell cycle progression. Representative pictures (left panel) and a summary graph (right panel) are shown (n = 3). *P < 0.05; **P < 0.01 vs Ctrl.

