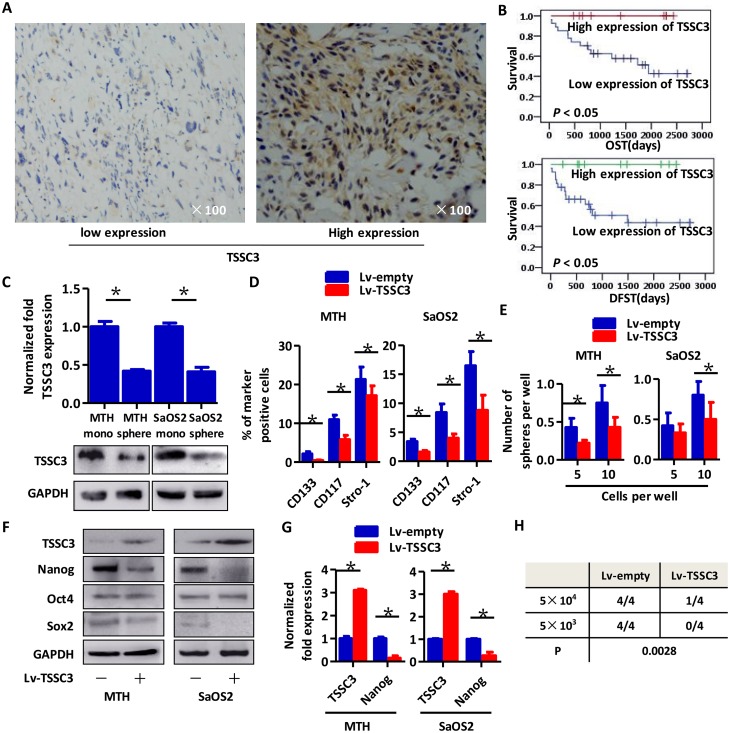
Figure 1. Higher expression of TSSC3 indicates improved prognosis for osteosarcoma patients, represses a stem-like phenotype of OS cells and decreases Nanog expression.
(A) Representative images of IHC staining of low (left panel) and high (right panel) TSSC3 expressing cells. (B) Kaplan-Meier curve showing that higher expression of TSSC3 is significantly associated with a better prognosis (P < 0.05). (C) TSSC3 expression in monolayer MTH or SaOS2 cells is higher than that of MTH or SaOS2 sphere cells, respectively (Bars, mean±SEM, *P < 0.05. Upper panel, RT-PCR; lower panel, Western blot). (D) The number of CD133, CD117, and Stro-1 positive MTH (left) or SaOS2 cells (right) significantly decreased after overexpression of TSSC3 (Bars, mean±SEM, *P < 0.05). (E) Efficiency of tumor sphere formation by Lv-TSSC3 MTH or Lv-TSSC3 SaOS2 cells is lower than that of Lv-empty MTH and SaOS2 cells, respectively (Bars, mean±SEM, *P < 0.05). (F) Nanog expression is reduced after TSSC3 overexpression in MTH (left) or SaOS2 (right) cells; meanwhile, Oct4 and Sox2 expression levels were slightly decreased. (G) Nanog expression is suppressed after overexpression of TSSC3 (Bars, mean±SEM, *P < 0.05). (H) There are significantly fewer xenografts generated by Lv-TSSC3 MTH than by Lv-empty MTH cells (N=4; P = 0.0028).

