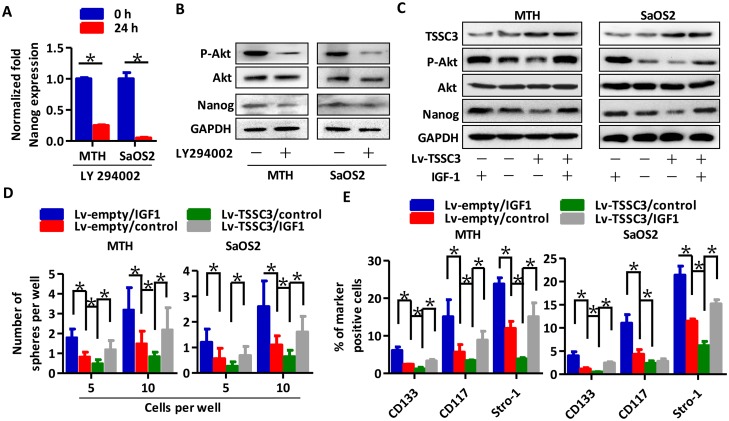
Figure 5. TSSC3 inhibits Nanog expression through the Akt pathway.
RT-PCR (A) and Western blot analysis (B) show that inactivation of Akt results in reduction of Nanog in OS cells (Bars, mean±SEM, *P < 0.05). (C) Overexpression of TSSC3 inactivates the Akt pathway, and decreases Nanog expression in MTH (left) and SaOS2 cells (right). Treatment with IGF1 activates the Akt pathway and increases Nanog expression. (D) Efficiency of tumor sphere formation by Lv-TSSC3 MTH (left) or SaOS2 cells (right) is lower than that of Lv-empty MTH and SaOS2 cells. IGF1 treatment enhances the efficiency (Bars, mean±SEM, *P < 0.05). (E) The number of CD133, CD117 and Stro-1 positive Lv-TSSC3 MTH (left) or SaOS2 cells (right) significantly decreases compared to Lv-empty cells. IGF1 treatment significantly enhances the number of marker positive cells (Bars, mean±SEM, *P < 0.05).

