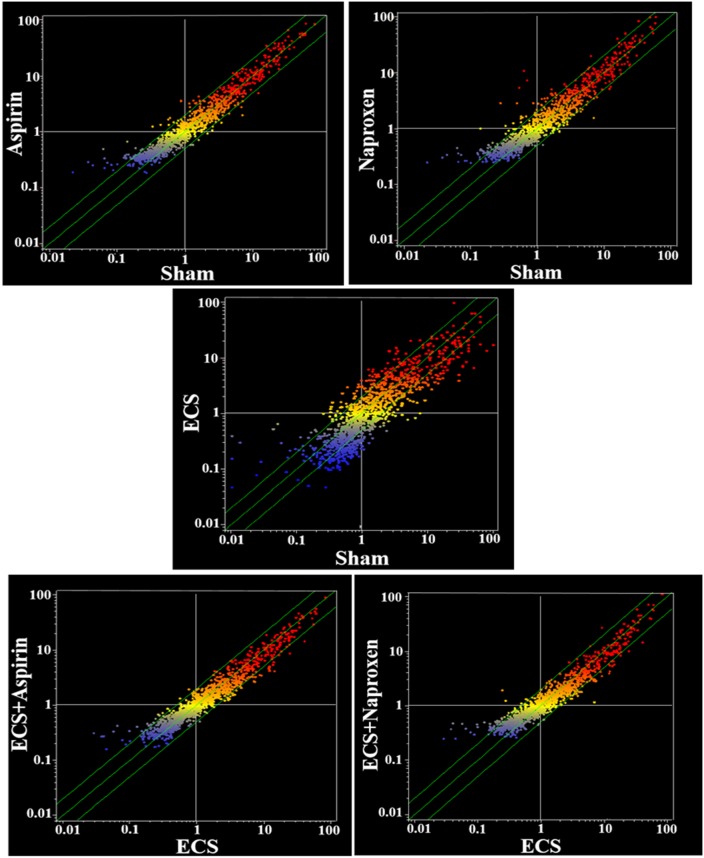
Figure 6. Scatter-plots comparing the overall expression of 1135 miRNAs in the blood serum of 10-week old A/J mice, as related to exposure to ECS since birth and/or treatment with aspirin or naproxen after weaning.
Each dot represents a miRNA, whose expression intensity can be inferred from the position in the x- and y-axes, according to a color scale (blue, low; yellow, medium; orange to red, high). The diagonal belts indicate the 2-fold variation interval. Symbols falling in the upper left area of each panel denote a higher expression of miRNAs in females compared to males, whereas symbols falling in the lower right area denote a higher expression of miRNAs in males compared to females.

