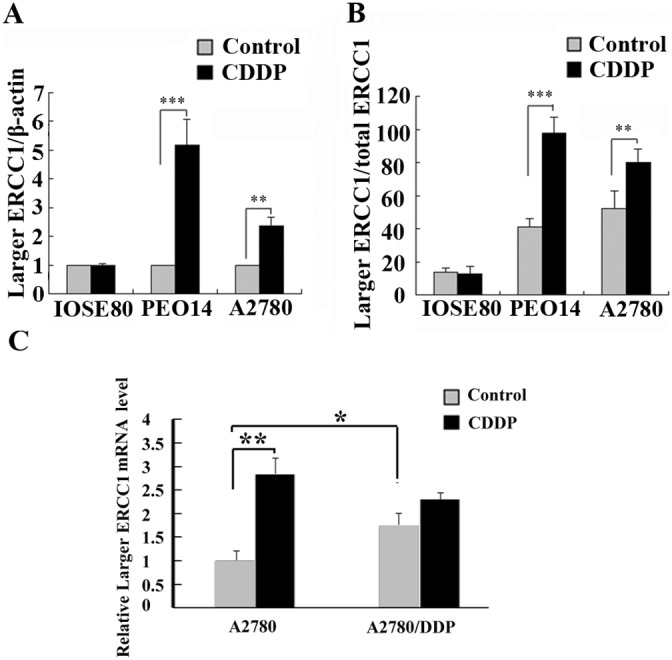
Figure 4. Comparison of the larger ERCC1 expression by cisplatin in different ovarian cells.

(A) Ovarian normal cells ISOE80, ovarian cancer cells PEO14 and A2780 were untreated, or treated with cisplatin (6 μM) for 48 h. Histogram shows the mean level (± SD) of larger ERCC1 mRNA relative to β-Actin determined from three independent experiments by qRT-PCR. Data were normalized to the mean level of larger ERCC1 relative to β-Actin in the controls. (B) Histogram shows the ratio (± SD) of larger ERCC1 mRNA relative to total ERCC1 mRNA determined from three independent experiments by qRT-PCR. Larger ERCC1 mRNA and total ERCC1 mRNA levels were each calculated relative to β-Actin. (C) Platinum-sensitive ovarian cancer cells A2780 and platinum-resistant A2780/DDP were untreated, or treated with cisplatin (6 μM) for 48 h. Histogram shows the mean level (+ SD) of larger ERCC1 mRNA relative to β-Actin determined from three independent experiments by qRT-PCR. Data were normalized to the mean level of larger ERCC1 relative to β-Actin in the A2780 control. Student’s t-test, * p<0.05, ** p<0.01, *** p<0.001.
