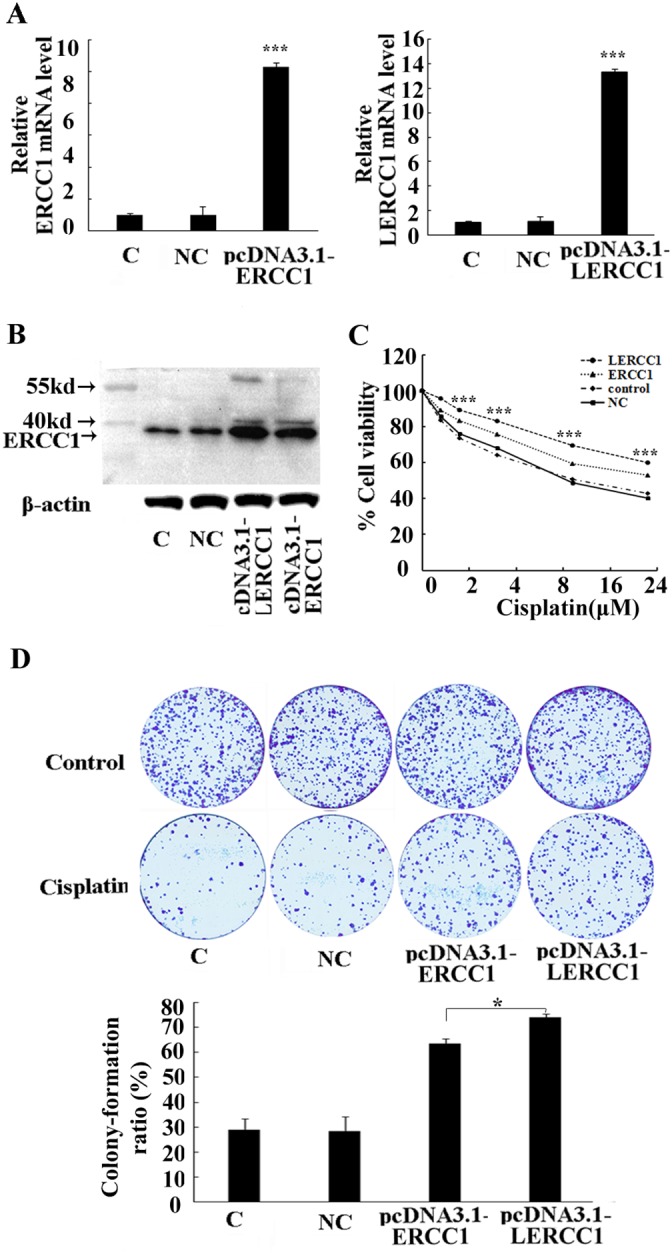
Figure 5. Overexpression of the larger ERCC1 transcript induced the resistance to cisplatin.

A2780 cells were transfected with either pcDNA3.1-LERCC1, pcDNA3.1-ERCC1 or pcDNA3.1 vector as the negative control (NC). (A) The expression of the larger or total ERCC1 mRNA was detected by qRT-PCR. Histogram showed mean levels (+ SD) of the larger or total ERCC1 mRNA against β-Actin. (B) The expression of ERCC1 protein was detected by Western blotting. Histogram showed the levels of ERCC1 relative to β-Actin. (C) The cells were treated with cisplatin (6 μM) for 48 h. The cells' viability was detected by MTT assay and expressed relative to that of non-transfected cells. (D) The cells were treated with cisplatin (2 μM) for 15 days. The surviving colonies were stained and counted. The colony numbers were counted and the colony formation ratio was calculated according to the formula: Colony formation ratio (%) = (number of colonies/number of cells seeded)×100. Three independent experiments were performed.* P<0.05, ** P<0.01, *** P<0.001, Student’s t-test.
