
Figure 1. DAI scores and histopathological changes in the colon of rats in differently treated groups after induction by TNBS.
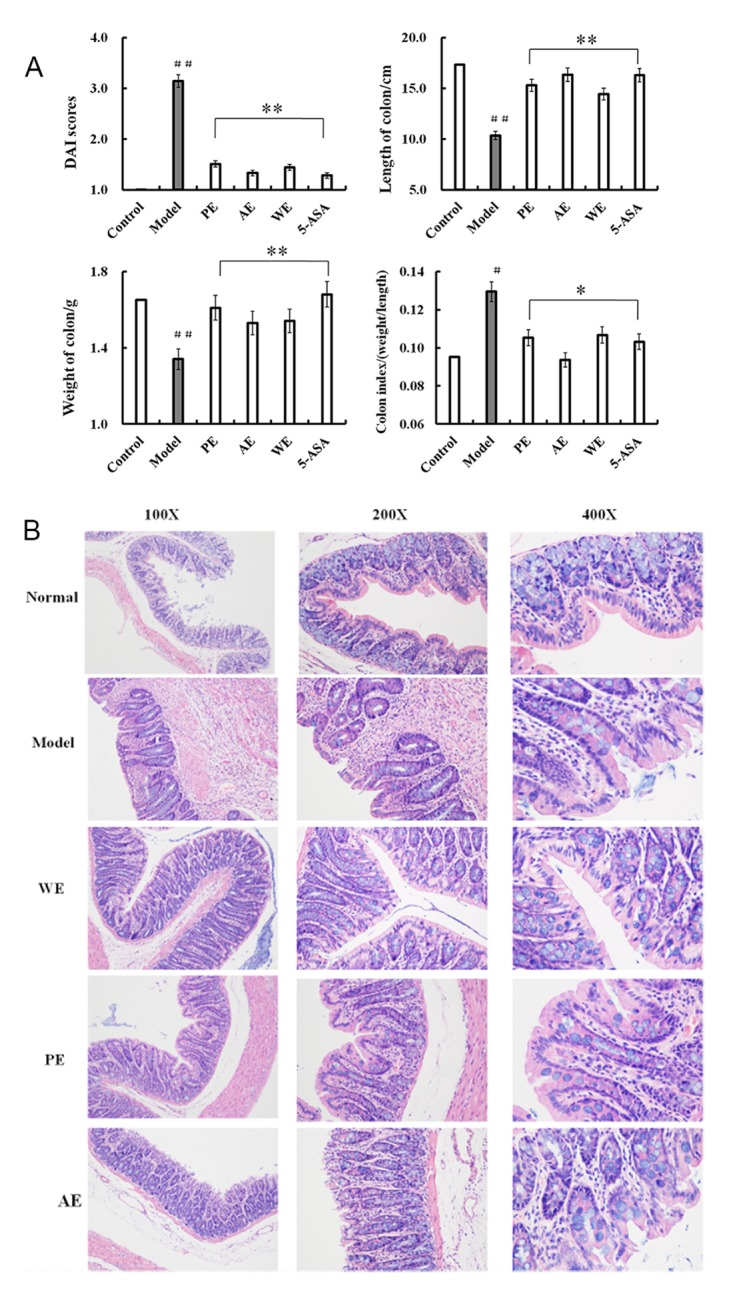
DAI scores were calculated according to the (A) weight loss, stool consistency, and blood in feces, length of the colon, weight of the colon, and the colon index (weight/length), with six rats per group; (B) histopathological changes in the colon. Normal, group without any treatment; model, the TNBS-induced group; WE, the whole extract-treated group after TNBS induction; PE, the polysaccharides extract-treated group after TNBS induction; AE, the alcohol extracts-treated group after TNBS induction. Values are expressed as means ± standard deviation. #P < 0.05 vs the control group, *P < 0.05, **P < 0.01 vs the model group, indicating significant differences compared with the model group.