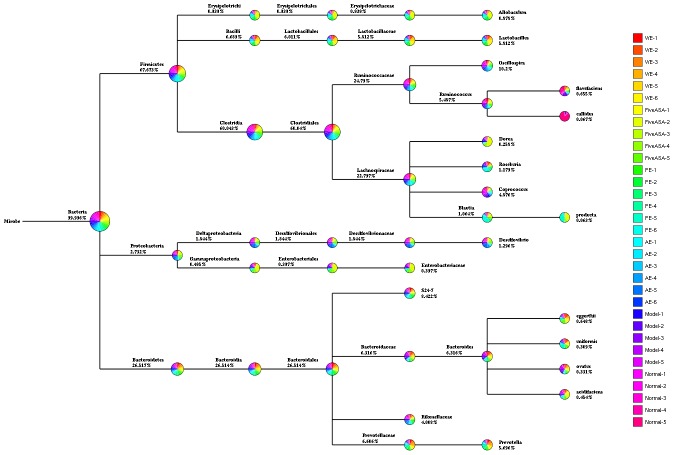
Figure 5. Tree species classification of the differently treated samples from IBD rats induced by TNBS enema.
The pie chart of different colors represents different samples in that classification unit. The size of the radius denotes the tag number accounts for the proportion of the total tag; the larger the radius, the higher the abundance. The numbers next to the pie chart represent the percentage of tag number of the percentage of the total tag.

