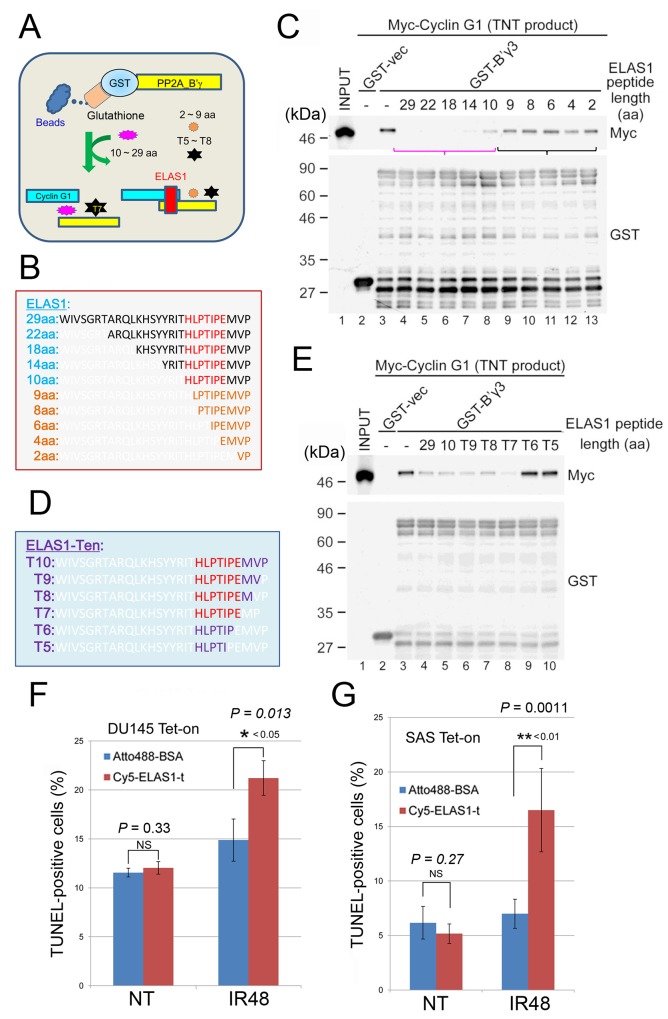
Figure 7. Determination of the minimum fragment of ELAS1 that retains its original apoptosis-inducing function.
(A) A schematic presentation of the experimental protocol. (B–E) Amino acid sequences of ELAS1-derived peptides truncated from its N-terminus (B) or ELAS1-t-derived peptides truncated from its C-terminus (D) that were used for the inhibition experiments. Wb to examine the inhibitory effect of ELAS1-derived peptides on the CycG1-B’γ association using an anti-Myc antibody. (C, E) Wb with an anti-GST antibody to show the use of equal amounts of GST-B’γ3 protein. (F, G) The bar graph shows the percentage of TUNEL-positive cells in the microscopy images (Supplementary Figure 10). The data represent the means and SD of three independent experiments (200 cells were counted per experiment).

