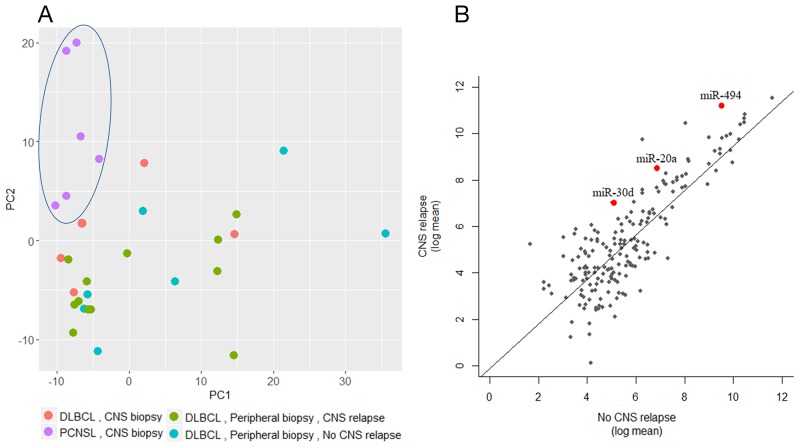
Figure 1. global miRNA expression analysis.
(A) Principal component analysis of 29 samples analyzed via NanoString. Each dot represents the collective expression of all microRNAs in one sample. Each color is indicative of a different lymphoma group. PCNSL samples (purple dots, marked by an ellipse) demonstrate global miRNA expression that differs from the other study groups of systemic lymphomas (green- with subsequent CNS relapse and turquoise- without subsequent CNS relapse) and from brain biopsies of relapsed systemic lymphoma (red dots). (B) Log mean expressions of 137 microRNAs that passed quality control filters of NanoString analysis compared between the CNS relapse and the no CNS relapse DLBCL groups. Each dot represents miRNA, red represent miRNA with significant differential expression.

