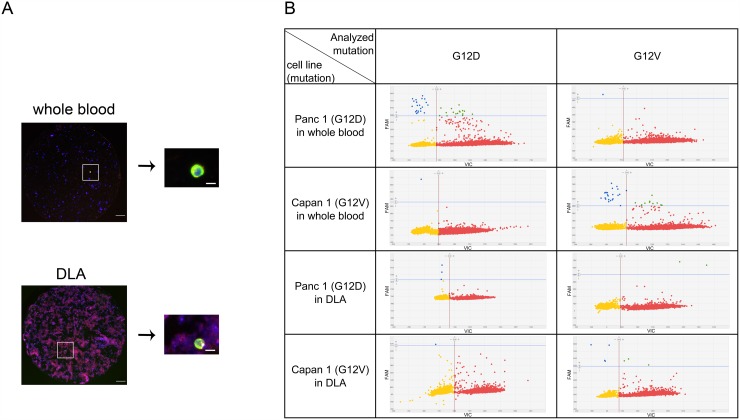
Figure 4. Mutation detection of CTCs in whole blood and frozen DLA.
Red dots represent wild-type, blue dots the mutation, microwells with both signals are colored in green and microwells without signal yellow. (A) Detected cells were punched out from filter and relocated on the punch before WGA. (B) Amplified DNA was analyzed by digital PCR for KRAS G12D and KRAS G12V. Note higher background of leukocytes in DLA. Scale bars represent 200μm (filter) and 20μm (single cell).

