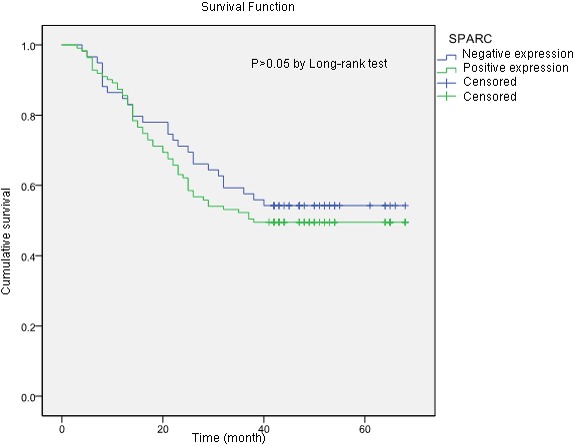
Figure 6. The Kaplan-Meier survival curves of two groups of gastric cancer patients according to the tissue expression of SPARC protein.

The samples with more than 10% of the stromal cells stained either moderately or strongly for SPARC was included in the SPARC positive group. The estimated survival time of patients in SPARC positive group was shorter than that in the SPARC negative group (42.7 months vs 45.4 months), but the difference was not statistically significant (P>0.05).
