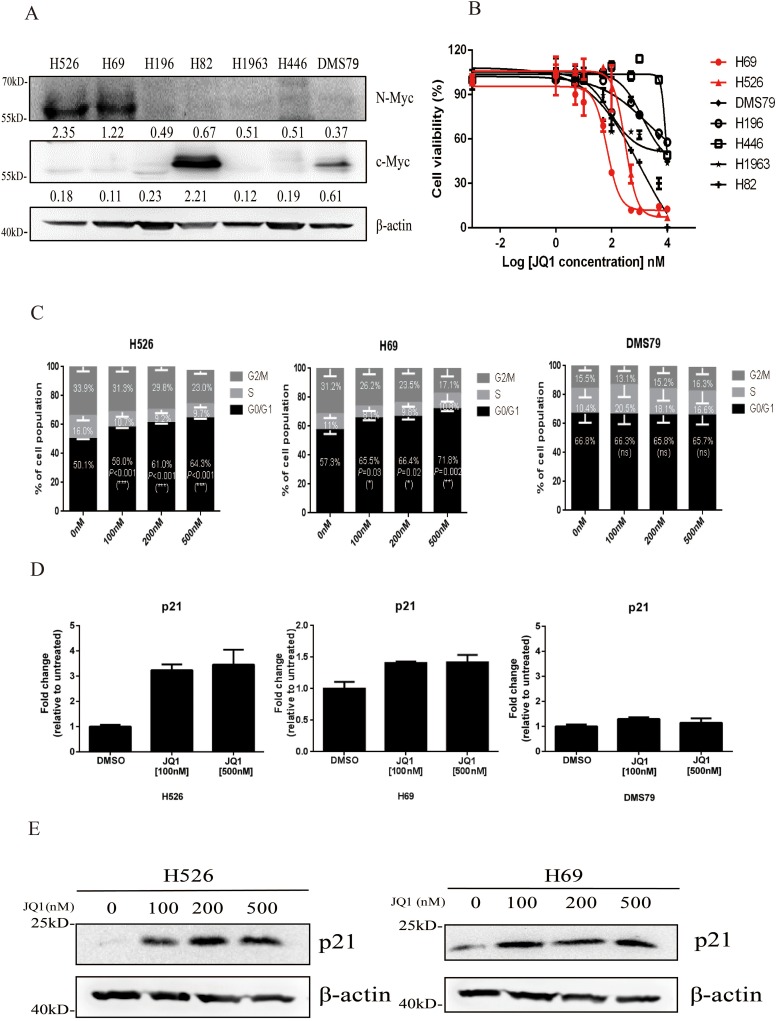
Figure 1.
(A) Protein expression of c-Myc and N-Myc in a panel of SCLC cell lines by western blotting analysis. β-Actin was used as a loading control. Protein band intensities were quantified by ImageJ and normalized to Actin. (B) Growth inhibition curves of JQ1 in a panel of SCLC cell lines. SCLC cells were treated with different concentrations of JQ1 for 72 hours. CellTiter-Glo Luminescent assay was performed to evaluate the cell proliferation. Red curves represent MYCN-amplified cell lines, which are sensitive to JQ1. (C) Cell cycle distributions of H526, H69 and DMS79 cells treated with DMSO control or different concentrations of JQ1. Average percentage of cell population in different phases of cell cycle from 3 independent experiments was shown. Statistical significance of JQ1 treatment vs. DMSO control was indicated. (D) JQ1 induces p21 mRNA expression in MYCN-amplified SCLC cells. H526, H69 and DMS79 cells were treated with JQ1 or DMSO for 24 hours. Relative mRNA expression level of p21 was detected by quantitative RT-PCR. (E) JQ1 induces p21 protein expression in MYCN-amplified SCLC cells. H526 and H69 cells were treated with JQ1 or DMSO for 24 hours. Protein expression of p21 was detected by western blotting analysis. β-Actin was used as a loading control.

