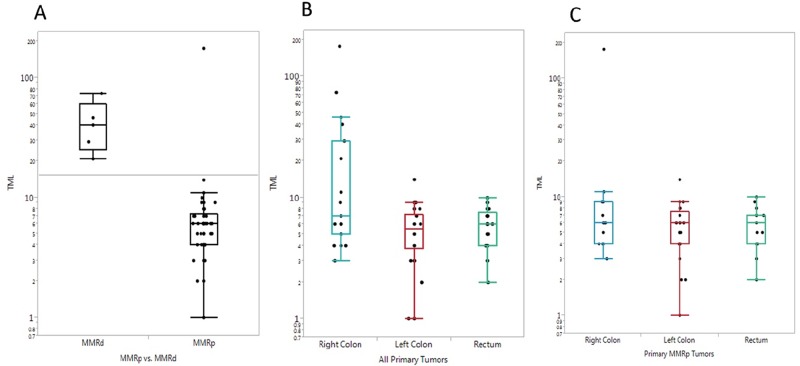
Figure 4. Box plots of mutational load seen in each tumor and correlation with MMR status and tumor location.
(A) Mutational load per tumor (number of mutations per megabase) in MMRp and MMRd tumors. (B) Mutational load comparison in primary tumors of the right colon, left colon, and rectum. (C) Mutational load comparison in MMRp primary tumors of the right colon, left colon, and rectum.

