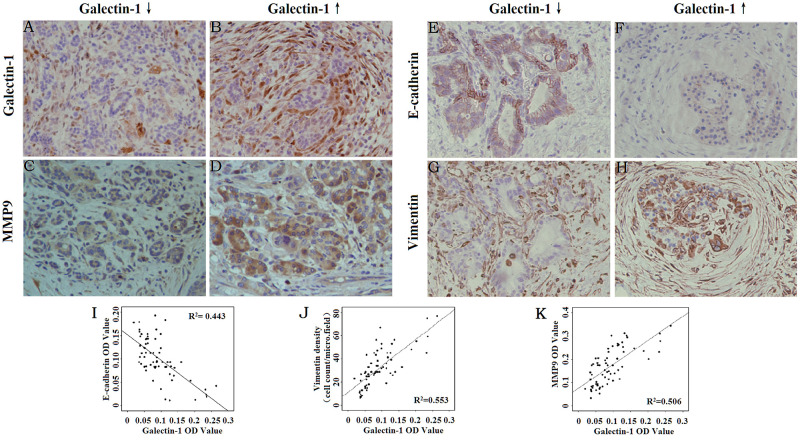
Figure 1. Correlation between Galectin-1 expression and the expression of EMT markers and MMP9.
Immunohistochemical staining for Galectin-1 (A, B), MMP9 (C, D), E-cadherin (E, F), and Vimentin (G, H) in PDAC tissues. Original magnification: ×200. (I) Correlation analysis of the mean density of Galectin-1 and E-cadherin. (J) Correlation analysis of the mean density of Galectin-1 and Vimentin. (K) Correlation analysis of the mean density of Galectin-1 and MMP9.

