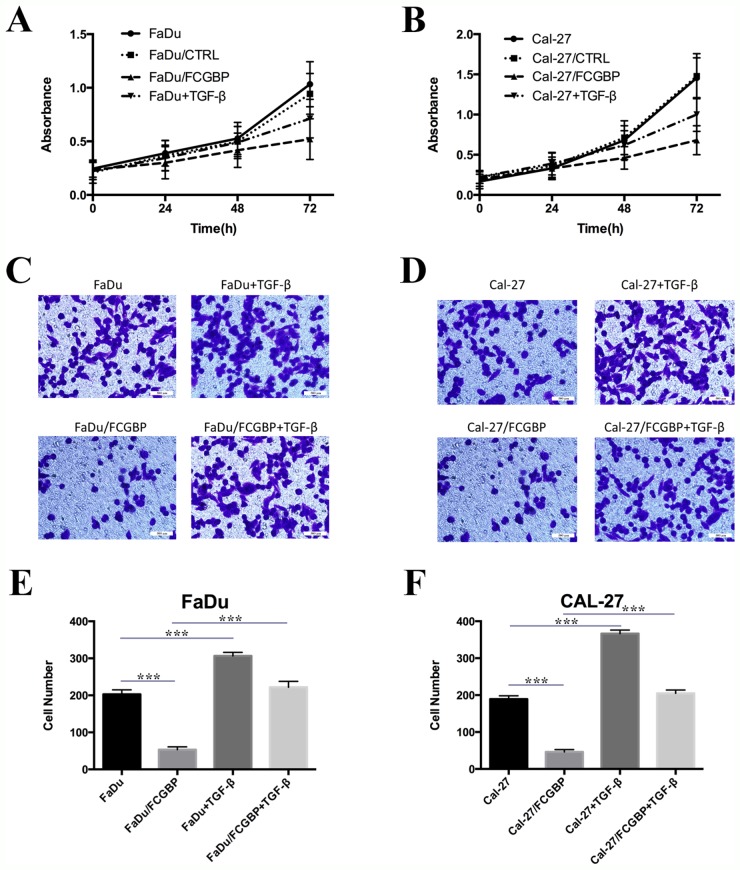
Figure 4. Proliferation and migration capacity change of HNSCC Cal-27 and FaDu cells after FcGBP overexpression.
(A) Multiplication curve of FaDu, FaDu/CTRL, FaDu/FcGBP and FaDu/FcGBP+ 5ng/ml TGF-β. (B) Multiplication curve of Cal-27, Cal-27/CTRL, Cal-27/FcGBP and Cal-27/FcGBP+ 5ng/ml TGF-β. (C) Transwell detection results of FaDu, FaDu/CTRL, FaDu/FcGBP and FaDu/FcGBP+ 5ng/ml TGF-β. (D) Transwell detection results of Cal-27, Cal-27/CTRL, Cal-27/FcGBP and Cal-27/FcGBP+ 5ng/ml TGF-β. (E) Represent histogram of (C) showed the difference of cell numbers between four groups. (F) Represent histogram of (D) showed the difference of cell numbers between four groups. *p<0.05; **p<0.01; ***p<0.001.

