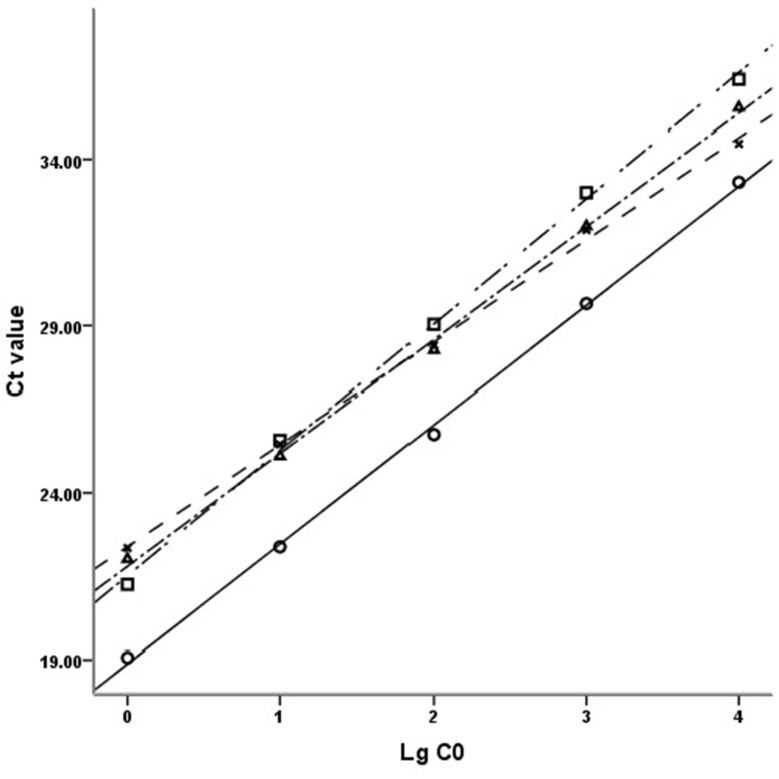
Figure 4. Standard curves of DRD2, GAPDH, Akt1 and PI3KCB.
The standard curves of DRD2, GAPDH, Akt1 and PI3KCB with 10-fold gradient dilution displayed good linear relationship. Ct value: Cycle threshold value; LgC0: Logarithm of the initial concentration; □: DRD2, y=-3.7679x + 40.352, R2=0.9983; ○: GAPDH, y=-3.5773x + 36.767, R2=0.9989; ∆: AKT1, y=-3.3937x + 38.760, R2=0.9984; ×: PI3KCB, y=-3.0661x + 37.709, R2=0.9986.

