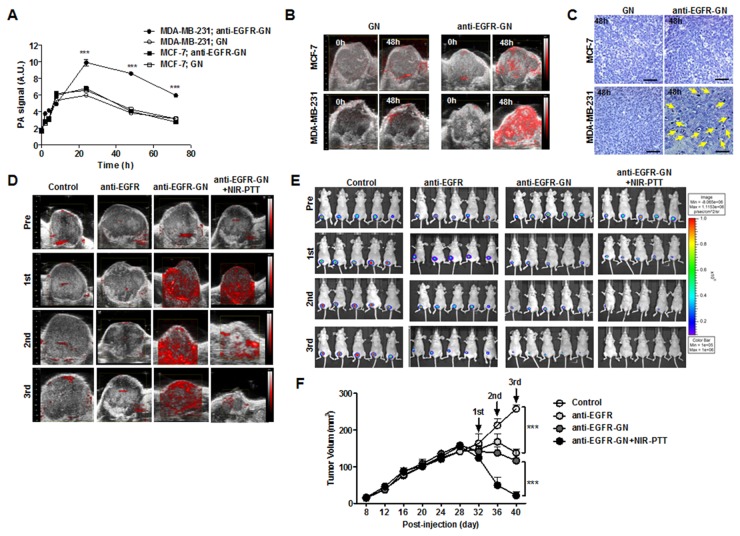
Figure 3. Analysis of PAI-and BLI-guided NIR-PTT combined with anti-EGFR-GN in xenograft tumors.
(A) PA signals (mean±S.E.) measured from MCF-7 and MDA-MB-231 tumors before and 2 h, 4 h, 8 h, 24 h, 48 h and 72 h after intravenous injection with of GN (7.7 mg/kg) or anti-EGFR-GN (7.7 mg/kg GN, 0.92 mg/kg anti-EGFR antibody). (B) Representative US and PAI in MCF-7 and MDA-MB-231 tumors before and at 48 h after injection of GN or anti-EGFR-GN. (C) Silver staining of MCF-7 and MDA-MB-231 tumors isolated from mice at 48 h post-injection. Yellow arrows indicate the accumulated anti-EGFR-GNs. Scale bar: 200 μm. (D and E) NIR-PTT was performed at 48 h after injection of anti-EGFR-GN three times at 3-day intervals. Serial follow-up PAI and BLI of tumors in of each group before and after administration of anti-EGFR antibody (0.92 mg/kg), anti-EGFR-GN (7.7 mg/kg) and anti-EGFR-GN (7.7 mg/kg GN, 0.92 mg/kg anti-EGFR antibody)+NIR-PTT. (F) Tumor volumes (mean±S.E.) measured from 5 tumors of each group. *P<0.05, **P < 0.01, ***P < 0.001.

