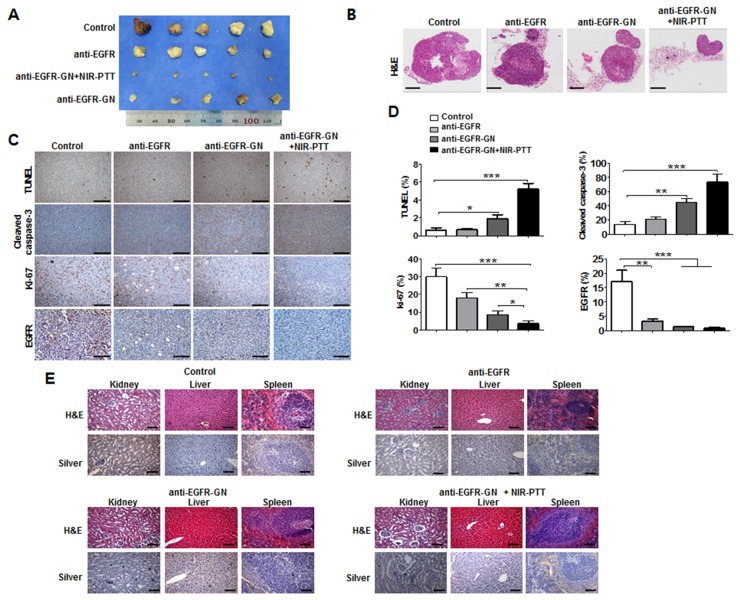
Figure 4. Histological analysis of xenograft tumors.
Tumor, kidney, liver and spleen was isolated from mice at 4 days after third treatment of anti-EGFR antibody (0.92 mg/kg), anti-EGFR-GN (7.7 mg/kg GN, 0.92 mg/kg anti-EGFR antibody)+NIR-PTT. (A and B) Gross images and H&E images of tumors isolated from each mouse group. (C) Immunohistochemistry images of TUNEL, cleaved caspase-3, Ki-67 and EGFR. (D) Quantitative analysis (mean±S.E.) of immunohistochemistry obtained from 5 tumor sections of each group. (E) H&E and silver staining of kidney, liver and spleen tissues isolated from each mouse group. Scale bar: 100 μm. *P<0.05, **P < 0.01, ***P < 0.001.

