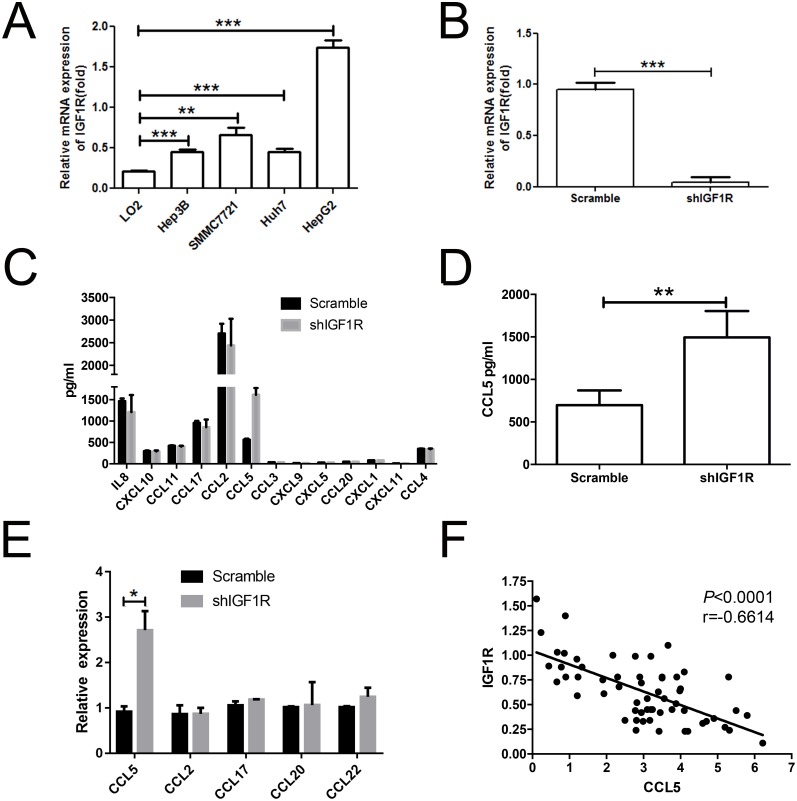
Figure 5. Knockdown of IGF1R led to the increase of CCL5 secretion.
(A) Real-time PCR analysis of IGF1R expression in LO2, SMMC-7721, Hep3B, HepG2, and Huh7 cell lines. (B) The mRNA level of IGF1R was verified in sorted HepG2 cells after transfection. (C) Results of scramble shRNA and shIGF1R HepG2 cells supernatants analyzed by multiplex assay in relation to chemokines. (D) The protein level of CCL5 in sorted HepG2 cells was assessed by using ELISA. (E) The level of CCL5 in sorted HepG2 cells was assessed by RT-PCR. (F) Association between the expression of IGF1R and the intensities of CCL5 in tumor lesions. (*P < 0.05, **P < 0.01, ***P < 0.001).

