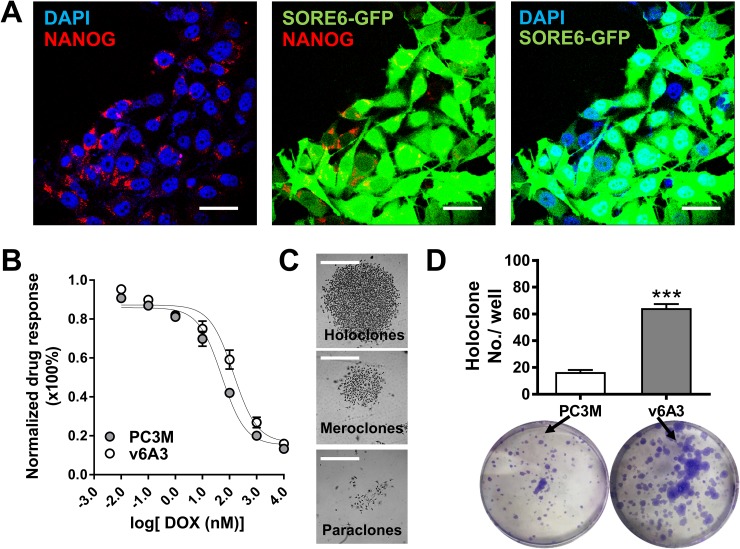
Figure 5. In vitro characterization of v6A3 cells.
(A) Confocal immunofluorescence images of NANOG (red) and concordant GFP expression (green) in v6A3 cells. The positive perinuclear NANOG staining was detected by an anti-NANOG Ab and a PE conjugated secondary Ab. Cell nuclei were stained by DAPI (blue). Scale bar, 30 μm. (B) The DOX resistance of v6A3. An MTT assay was used to compare the response of PC3M (gray circle) with those of v6A3 (white circle) cells to DOX. A growth inhibition curve was generated using GraphPad Prism 6.0 software. Absolute IC50 values were calculated using the log inhibitor vs. response curves for nonlinear regression. (C) Representative colony morphology of holoclones, meroclones and paraclones formed by v6A3. Scale bar, 300 μm. (D) Colony formation assay of v6A3 (gray bar) and PC3M (white bar) cells. The number of holoclones observed per well was scored to determine the efficiency of colony formation. The data presented for each group are the averages with standard deviations from triplicate samples. ***, P < 0.001.

