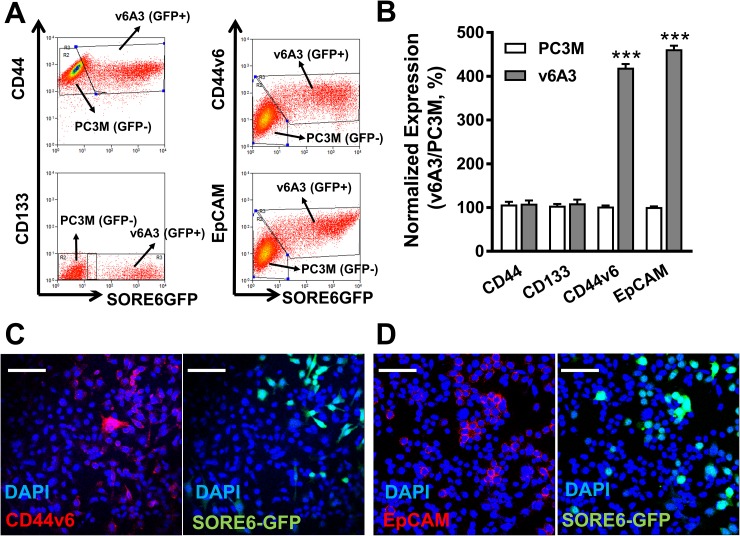
Figure 6. CD44v6 highly expressed PC3M subpopulations enriched in v6A3 cells.
(A) Flow cytometry analysis of the expression of CD44v6, EpCAM, CD44 and CD133 in a 1:1 mixture of PC3M (SORE6-GFP-) and v6A3 cells (SORE6-GFP+). Two gates were used based on the GFP signal (x axis) to separate PC3M and v6A3 cells. The cell bound primary Abs were detected by APC conjugated secondary Ab. The MFI of APC signal (y axis) detected from each gate was calculated to present the expression level of these four biomarkers. (B) The normalized expression levels of the four surface markers were calculated as the ratio of MFI of v6A3 (gray bar) to those of PC3M (white bar) cells. The data presented in each group are the averages with standard deviations from triplicate samples. ***, P < 0.001. Immunofluorescence confocal analysis of the expression of CD44v6 (C) and EpCAM (D) in mixed cultures of PC3M and v6A3 cells (green). The cell bound primary Abs were detected by PE conjugated secondary Ab (red). Cell nuclei were stained by DAPI (blue). Scale bar, 80 μm.

