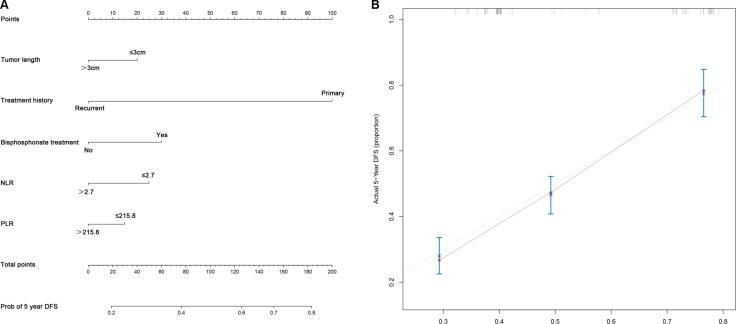
Figure 2. Nomograms convey the results of prognostic models using clinical characteristics and pretreatment inflammatory biomarkers to predict DFS of patients with GCT.
(A) Nomograms can be interpreted by summing up the points assigned to each variable, which is indicated at the top of scale. The total points can be converted to predicted probability of recurrence for a patient in the lowest scale. (B) Calibration curves for DFS using nomograms with clinical characteristics and pretreatment inflammatory biomarkers are shown. The Harrell’s c-indexes for OS and DFS prediction were 0.728 (95% CI: 0.710–0.743). The x-axis is nomogram-predicted probability of survival and y-axis is actual survival. The reference line is 45° and indicates perfect calibration.

