Figure 3.

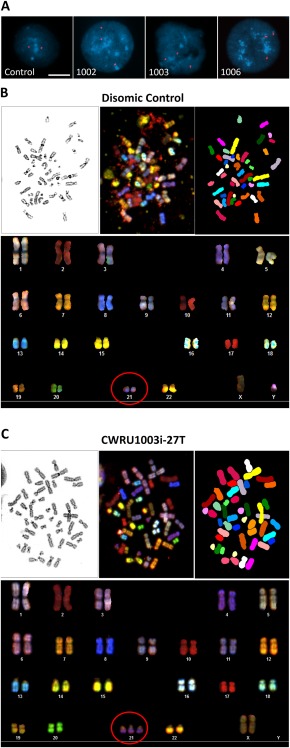
Cytogenetic genotyping of induced pluripotent stem cells (iPSCs). (A): Representative images of nuclei hybridized with fluorescent chromosome 21 probes (FISH) from four individual iPSC clones (Control, CWRU1002i, CWRU1003i, CWRU1006i). Nuclei were counterstained with DAPI, scale bar = 10 µm. Representative spectral karyotyping (SKY) images of chromosomes from disomic control (B) and cell line CWRU1003i (C). The upper panels of (B) and (C) show metaphase spread images using inverted DAPI staining (left), a spectral representation (middle), and SKY pseudocolor classification of chromosomes based on multicolor dye hybridization (right). The lower panels are the resulting karyotype tables of each cell line. The red circles highlight chromosome 21 in disomic or trisomic state.
