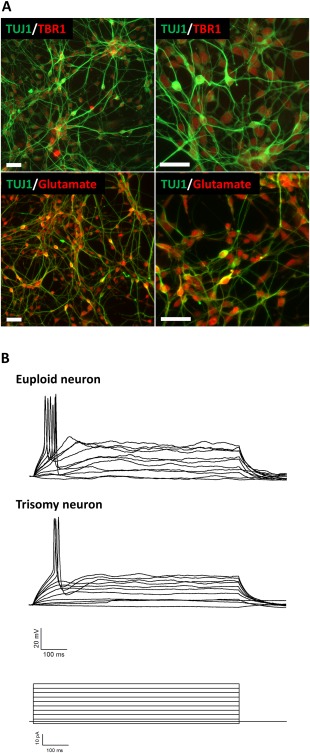
Figure 4.

Generation of glutamatergic neurons. (A): Low (left) and high (right) magnification images of cell cultures 20 days after induced pluripotent stem cells (iPSCs) differentiation into glutamatergic neurons. Immunofluorescence staining was performed using antibodies against TUJ1, TBR1, and glutamate, scale bar = 50 µm. (B): Whole‐cell patch‐clamp recordings obtained from the cell soma made in current‐clamp mode. The top set of traces are representative action potentials from neurons derived from euploid iPSCs. The middle set of traces are representative recordings of from neurons that were generated from T21 iPSCs. Stimulus protocol (current steps) is shown at the bottom.
