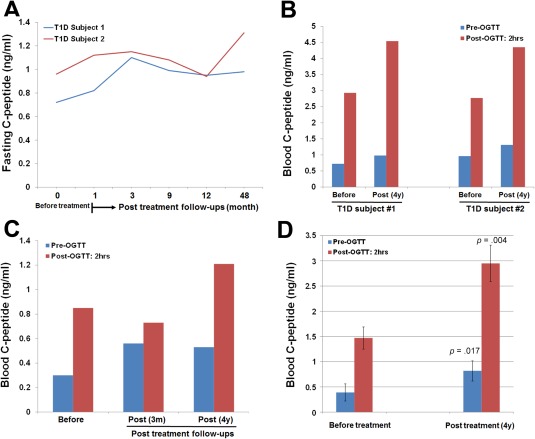
Figure 1.

Long‐term follow‐up studies of SCE therapy in Chinese T1D and T2D subjects. All Chinese subjects received one treatment with the SCE therapy. (A): Kinetic examination of fasting C‐peptide levels during the 4‐year follow‐up period. Before receiving a SCE therapy, subject #1 diagnosed with T1D for 8 months with glycated hemoglobin (HbA1C) at 11.3%, islet autoantibodies IA‐2A+ and GAD+; subject 2 diagnosed with T1D for 5 months with HbA1C at 9.4%, islet autoantibodies IA‐2A+ and GAD+ and IAA+. (B): Comparison of C‐peptide levels at a 75‐g oral glucose challenge after 4‐year follow‐up in T1D subjects 1 and 2. (C): Recovered fasting and high glucose‐stimulated C‐peptide levels were retained in subject 3 through the follow‐up at 4 years post‐treatment with a SCE therapy. (D): Comparison of fasting and high glucose‐stimulated C‐peptide levels after 4‐year follow‐up in long‐standing severe T2D subjects (N = 4). Data are presented as mean ± SD. Abbreviation: OGTT, oral glucose tolerance test.
