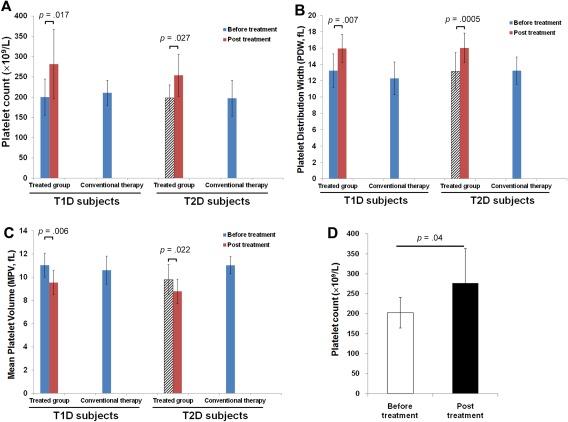
Figure 2.

Modulation of platelets by SCE therapy in diabetic patients. (A–C): Clinical data were summarized from the clinical trials in Chinese diabetic subjects. Both T1D (N = 10) and T2D (N = 16) received one treatment with SCE therapy. A complete blood count (CBC) test was performed at baseline (before the treatment) and 1 month after the treatment with SCE therapy. Age‐ and gender matched T1D (N = 7) and T2D (N = 10) subjects receiving conventional therapy served as controls. (A): Increase in the platelet count. (B): Increase in the platelet distribution width (PDW). (C): Decrease in the mean platelet volume (MPV). (D): Increase in the platelet count of Caucasian T1D subjects after receiving one treatment with SCE therapy, N = 8. Data are presented as mean ± SD.
