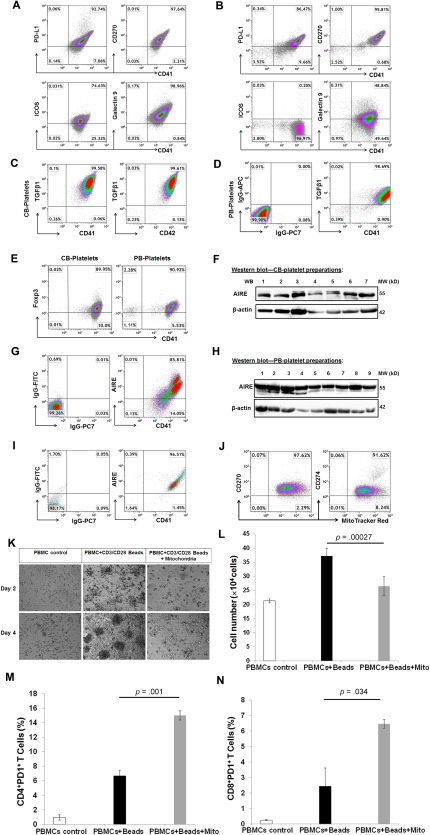
Figure 3.

Expression of immune modulation‐related markers in platelets and mitochondria. (A): Flow cytometry showed expression of co‐inhibitory surface markers PD‐L1, CD270, ICOS, and Galectin 9 on CB‐platelets (n = 9). (B): Flow cytometry showed the expression of co‐inhibitory surface markers PD‐L1, CD270, ICOS, and Galectin 9 on PB‐platelets (n = 8). (C): Intra‐cellular staining showed the expression of TGF‐β1 in CB‐platelets (n = 8). (D): Intra‐cellular staining showed the expression of TGF‐β1 in PB‐platelets (n = 4). (E): Intra‐cellular staining showed the expression of FoxP3 in CB‐ and PB‐platelets (n = 9 and 4, respectively). (F): Western blotting showed the expression of AIRE in seven cord blood preparations. (G): Double staining showed the expression of AIRE in CD41+ CB‐platelets (n = 5). (H): Western blotting showed the expression of AIRE in nine adult blood preparations. (I): Double staining showed the expression of AIRE in CD41+ PB‐platelets (n = 3). (J): Flow cytometry showed the expression of CD270 and CD274 (PD‐L1) on CB platelet‐releasing mitochondria labeled with MitoTracker Red. N = 7. (K): Phase contrast microscopy. Human PBMCs were activated with Dynabeads coupled with anti‐CD3 and anti‐CD28 antibodies, 30 U/ml rIL‐2 for 4 days, in absence (middle panels) and presence (right panels) of 70 μg/ml mitochondria. Untreated PBMCs (left right panel) served as control. Original magnification, ×40. (L): Quantification of cell proliferation after the treatment for 2 days. (M): Flow cytometry showed the increase in the percentage of CD4+PD1+ T cells. (N): Flow cytometry showed the increase in the percentage of CD8+PD1+ T cells. Data are presented as mean ± SEM from four experiments. Isotype IgGs serve as negative control for flow cytometry. Abbreviations: PBMC, peripheral blood‐derived mononuclear cells; ICOS, inducible costimulatory.
