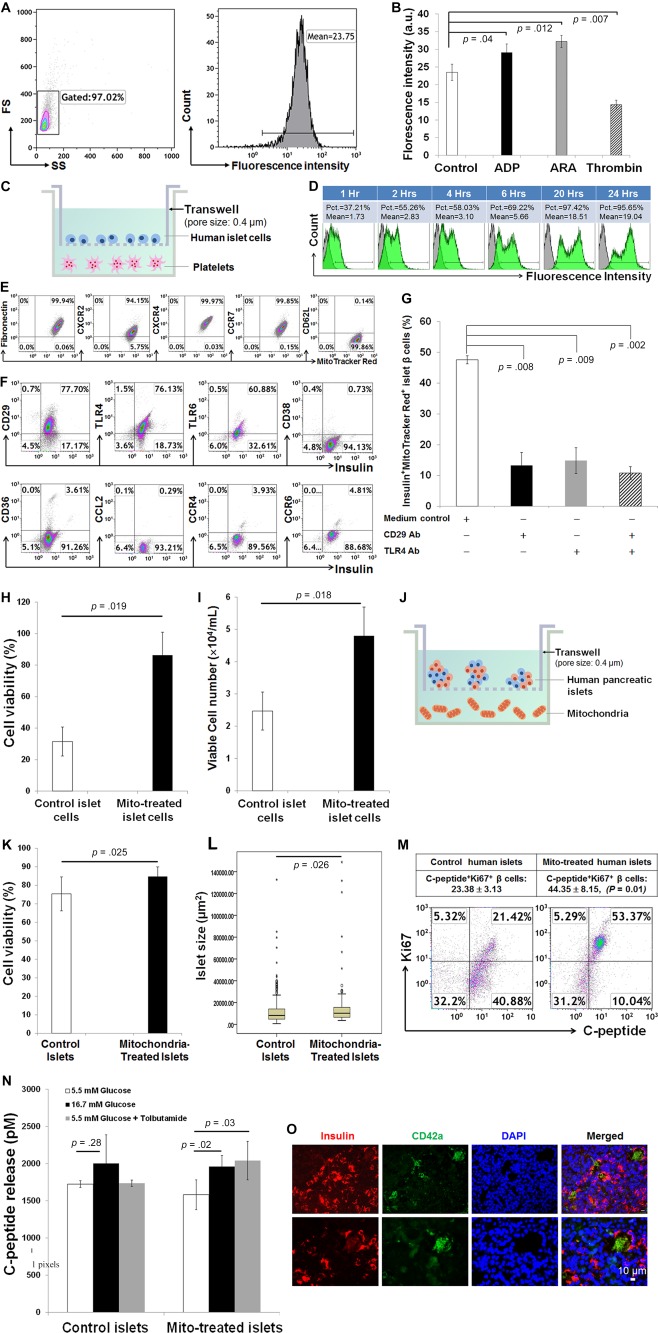
Figure 6.

Improve pancreatic islet β‐cell function by the platelet‐derived mitochondria. (A): Flow cytometry showed the basal release of mitochondria from platelets in dot plot (left) and histogram (right). (B): Effects of platelet aggregators on the releasing of mitochondria. Representative data of those obtained from four experiments. (C): Co‐culture of freshly‐isolated human pancreatic single islet cells (top chamber) with platelets labeled with MitoTracker Deep Red (bottom chamber) in Transwells. (D): Kinetic measurements by flow cytometry demonstrated that human pancreatic islet cells take up MitoTracker Deep Red‐labeled mitochondria released from platelets (bottom) in Transwell co‐culture. (E): Expression of chemokine and chemokine receptors on CB‐platelet‐derived mitochondria (n = 11). (F): Expression of adhesion molecules and chemokine receptors on human islet β cells. Representative data of those obtained from three experiments. (G): Migration and the taking up of mitochondria by human islet β cells were markedly declined in the presence of blocking Abs with anti‐CD29 and/or anti‐TLR4. (H): Cell viability was increased after single islet β cells co‐cultured with platelets in Transwells. (I): The number of islet β cells was increased after co‐culture with platelets in Transwells. (J): Co‐culture of freshly‐isolated whole human pancreatic islets (top chamber) with platelets labeled with mitochondria (bottom chamber) in Transwells. The pore size of transmembrane is 0.4 μm. (K): Islet cell viability was increased after co‐cultured with mitochondria. (L): The average islet size was increased after co‐cultured with mitochondria. (M): Flow cytometry indicates that the percentage of Insulin+Ki67+ islet β cells was increased after co‐cultured with mitochondria in Transwells. Mitochondria were purified from CB‐platelets (n = 4). (N): Functional analysis demonstrated that the C‐peptide release from islet β cells was enhanced in the presence of different insulin secretagogues. Data are presented as mean ± SEM (n = 3 experiments). (O): Immunohistochemistry of human pancreatic tissues from diabetic patients (N = 6) showed the migration of platelets into islets, with a formation of platelet clusters (green color, a platelet marker CD42a) at different sizes and close to islet β cells (red color, a β‐cell marker insulin). Scale bar, 10 μm. Abbreviations: ADP, adenosine diphosphate; ARA, arachidonic acid; Pct, percentage.
