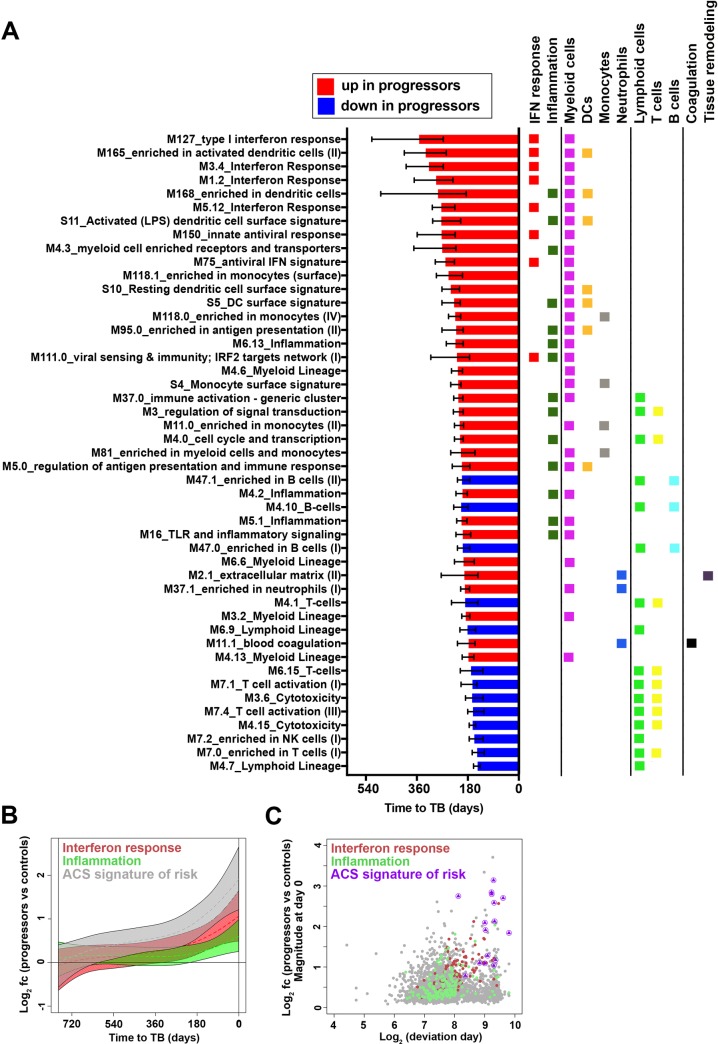
Fig 2. Sequential changes in distinct transcriptional modules during progression from M.tb infection to TB disease.
(A) Gene modules, pre-defined by Chaussabel and BTM, found to be significantly enriched in progressors, compared with controls, and ranked in descending order according to median deviation time points (indicated by bars) of genes differentially expressed between progressors and controls. Data from 38 progressors and 104 controls were included in the analysis. Error bars denote IQR of median deviation time points of differentially expressed genes within each module. Assignment of each module to known immunological responses or processes or cellular subsets, according to differentially expressed genes, is indicated by the colored squares. The full list of significantly enriched modules is in S4 Table. (B) Kinetics of type I/II interferon response or inflammation transcriptional gene modules, as well as the 16 genes in the ACS signature of risk of TB. For interferon responses we included genes with significant kinetic response from modules: M127_type I interferon response, M5.12_Interferon Response, M3.4_Interferon Response and M1.2_Interferon Response. For inflammation we included genes with significant kinetic response from modules: M6.13_Inflammation, M4.2_Inflammation, M5.1_Inflammation, M16_TLR and inflammatory signaling, M33_inflammatory response and M53_inflammasome receptors and signaling. Module kinetics during progression were modeled as non-linear splines and 99% CI (shaded areas) were computed by performing 2000 spline fitting iterations after bootstrap resampling from the full dataset. (C) Scatter plot showing fold change (log2 FC) plotted versus the time point at which the 99% CI deviates from a log2 fold change of 0 (log2 days before TB diagnosis) for genes in the IFN response and inflammation modules and the 16 genes in the ACS signature of risk of TB.

