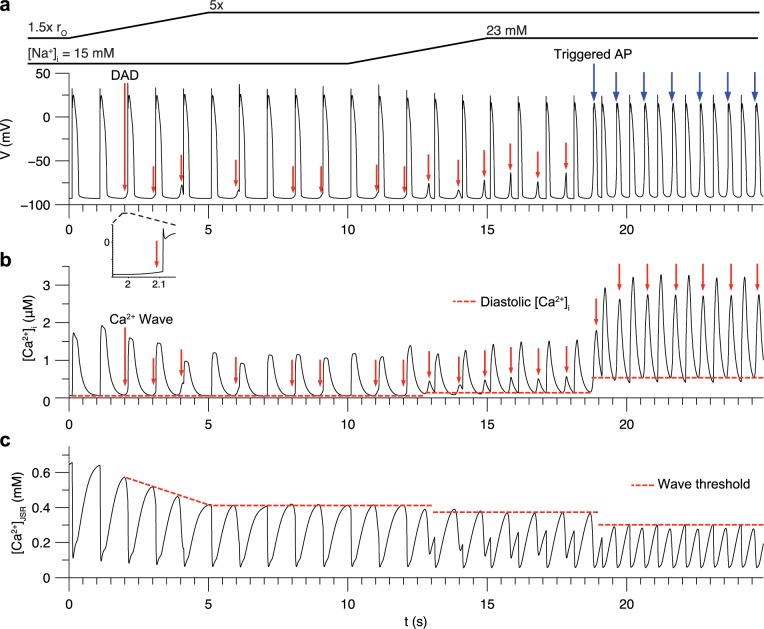
Fig 3. DADs induced by Ca2+ overload during 1 Hz pacing under β-adrenergic stimulation in the myocyte model.
(a) Sub-threshold DADs (red arrows) and triggered APs (blue arrows) in between paced APs. Inset illustrates how the first DAD occurred just prior to the next stimulus. (b) Spontaneous [Ca2+]i transients caused by underlying Ca2+ waves. Dotted lines indicate diastolic [Ca2+]i. (c) Average [Ca2+]JSR. Dotted lines indicate threshold for Ca2+ overload that resulted in spontaneous Ca2+ waves. This threshold decreased over the course of the protocol due to increased RyR sensitivity, increased [Na+]i, and elevated diastolic [Ca2+]i.

