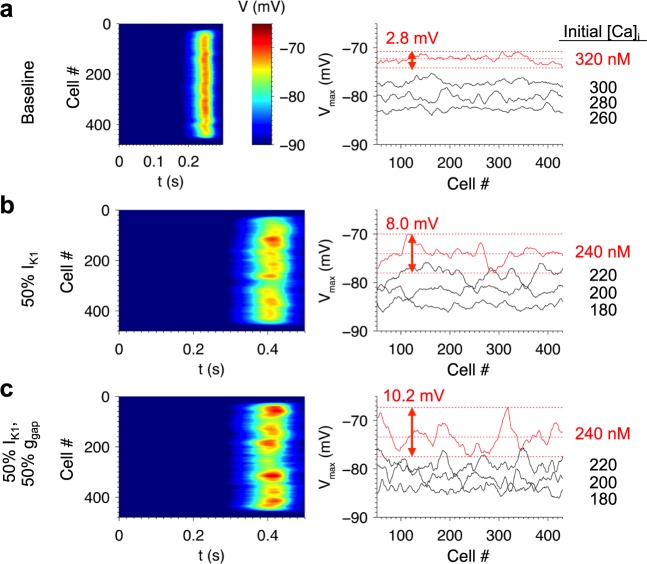
Fig 8. Roles of initial [Ca2+]i, IK1 density, and ggap in DAD variability in the fiber model.
(a) Spatiotemporal profile of V (left) and Vmax profile (right) in a 480-cell fiber under baseline conditions. Similar simulations are shown with 50% IK1 reduction (b) and both 50% IK1 and 50% ggap (c). The range of Vmax values are indicated for the red traces, which correspond to the images on the left. To avoid boundary effects, the outer 24 cells on either end were initialized to normal SR loads. The inner cells were initialized to identical initial conditions to those of Fig 6. All simulations initialized with [Na+]i = 10 mM.

