Figure 6.

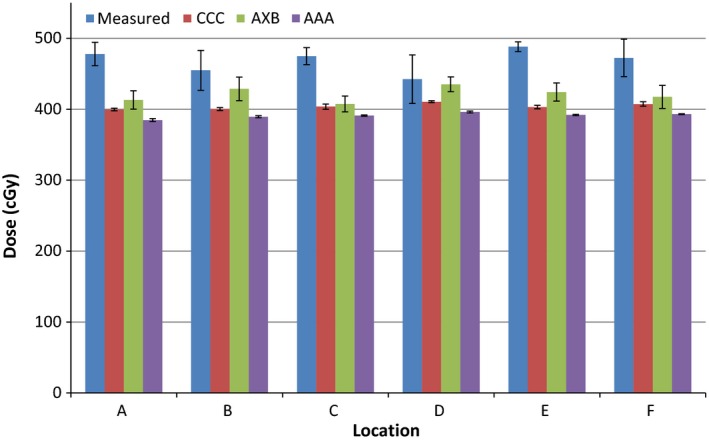
Measured and calculated doses using the three algorithms for 18 MV photons. Error bars represent standard deviations obtained from repeat measurements and regions of interest.

Measured and calculated doses using the three algorithms for 18 MV photons. Error bars represent standard deviations obtained from repeat measurements and regions of interest.