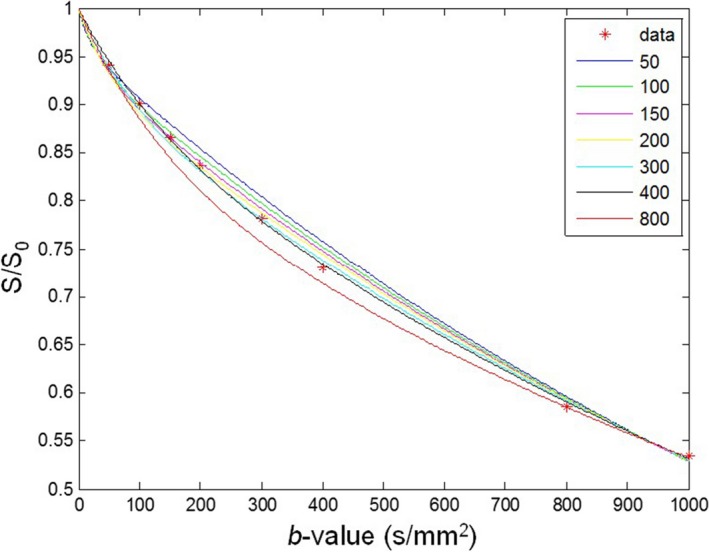
Figure 1.

Fitting curves obtained with different threshold b‐values from an ROI within a malignant lesion of a patient. Red dots denote averaged signal intensities measured from the ROI at different threshold b‐values. The numbers on the top right side of the figure represent each threshold b‐values.
