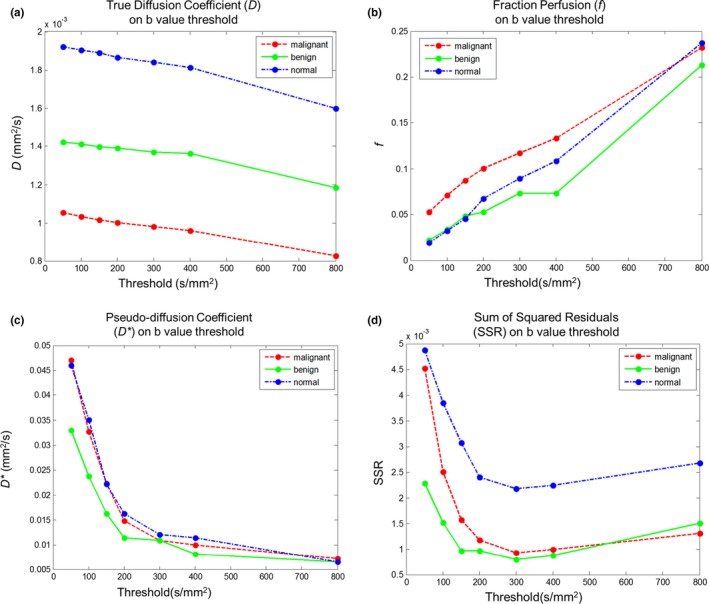
Figure 2.

Computation results for three parameters D (a), f (b), and D* (c), and SSR (d), under different threshold b‐values from three different ROIs, each containing with a malignant lesion, a benign lesion and a normal tissue. X‐axis is the threshold b‐value.
