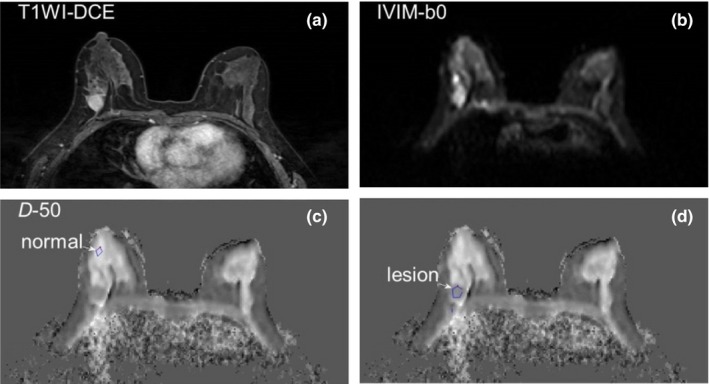
Figure 3.

Selection of ROIs for IVIM analysis from a slice in a patient case study. (a) T1‐weighted contrast‐enhanced breast image; (b) T2‐weight image of the same slice; (c) and (d) D maps calculated with threshold b‐value at 50 s/mm2, (c) is labeled with selected ROI location for normal tissue, and (d) is labeled with selected ROI location for a malignant lesion.
