Figure 4.

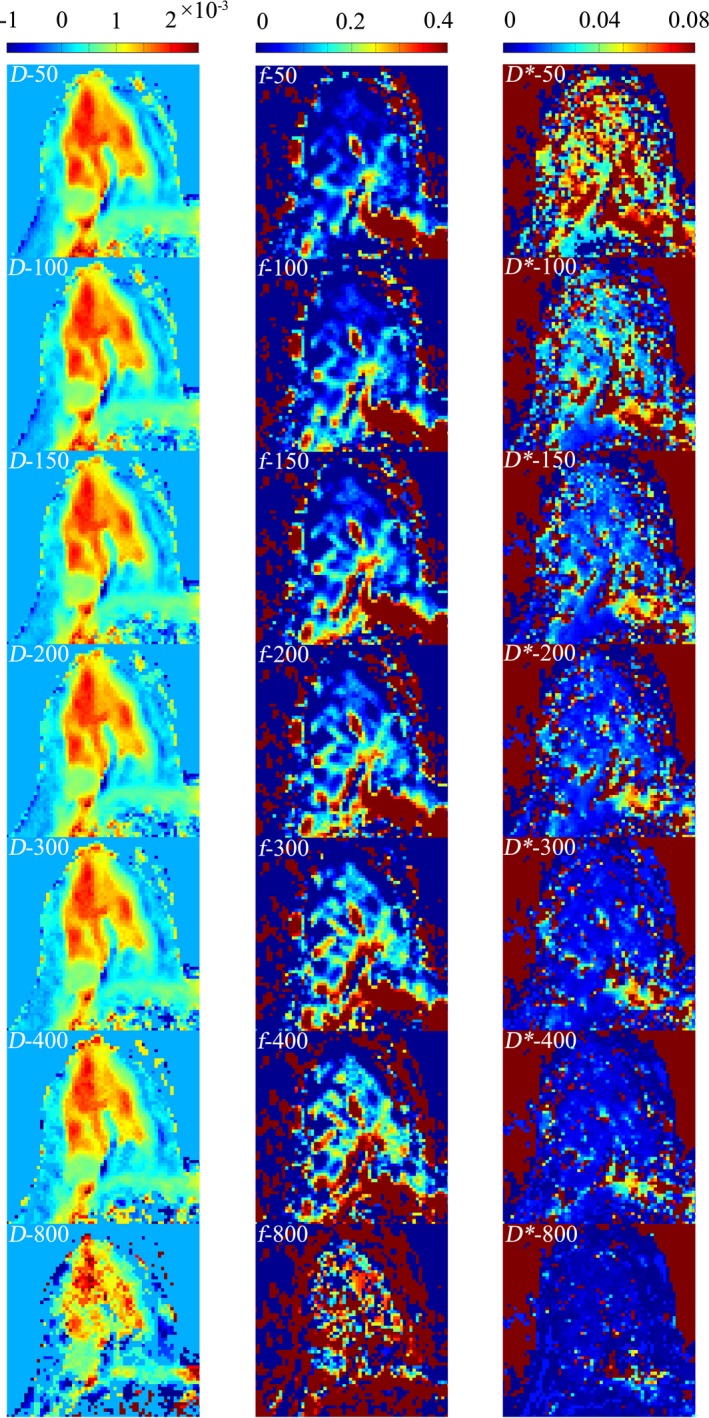
Three sets of IVIM‐derived parameter maps for D (mm2/s), f, and D* (mm2/s), from one of the patients using different threshold b‐values.

Three sets of IVIM‐derived parameter maps for D (mm2/s), f, and D* (mm2/s), from one of the patients using different threshold b‐values.