
Figure 4.
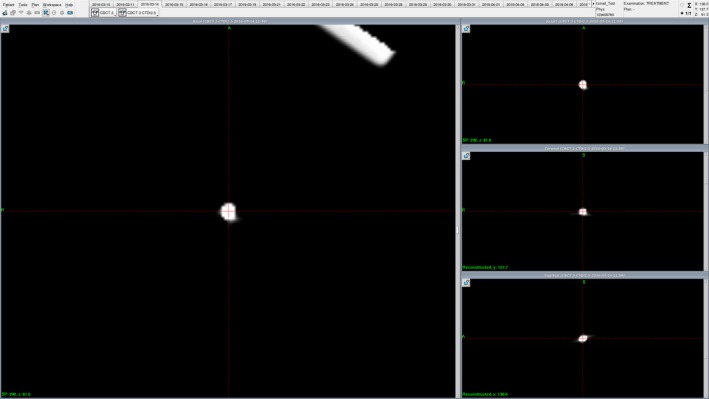
A snapshot of the Leksell GammaPlan treatment planning software showing a zoomed‐in and maximally contrasted CBCT image of one of the markers (marker (a) is shown here). The coordinates reported for each marker were the average of three readings of the geometrical center of markers as determined visually by a single observer.