Figure 5.

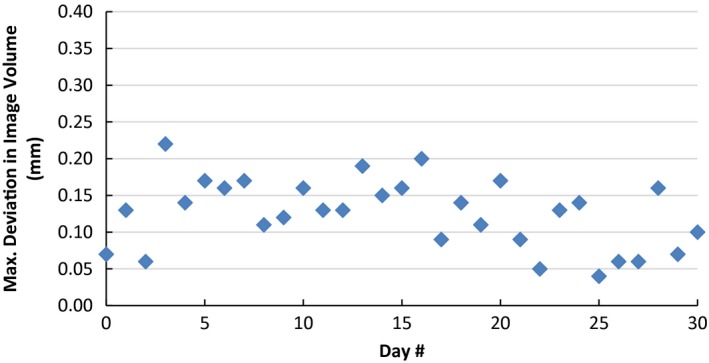
Results of daily CBCT precision QA test. The graph shows the variation of maximum deviation in image volume between the daily QA tool Plus and the expected baseline taken during calibration of the tool.

Results of daily CBCT precision QA test. The graph shows the variation of maximum deviation in image volume between the daily QA tool Plus and the expected baseline taken during calibration of the tool.