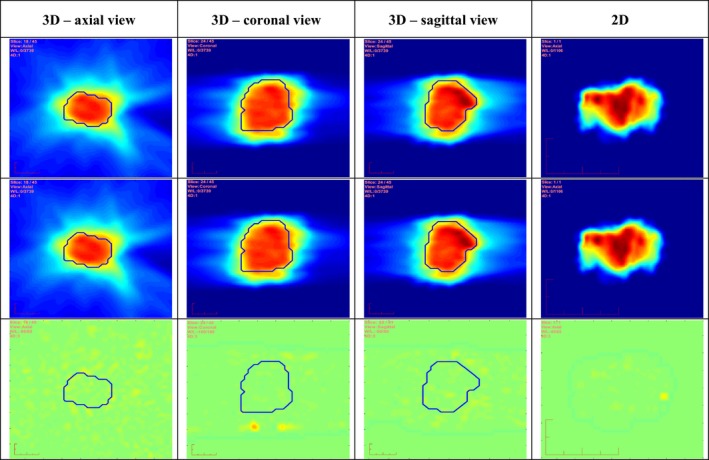
Figure 3.

Results of 3D and 2D fluences from a four‐arc lung VMAT plan. Top row is from the DICOM plan. Middle row is from the log file. Bottom row is obtained by calculating the corresponding fluence differences. The PTV contours in the respective 3D orthogonal views are overlaid on the 3D fluences.
