Figure 3.

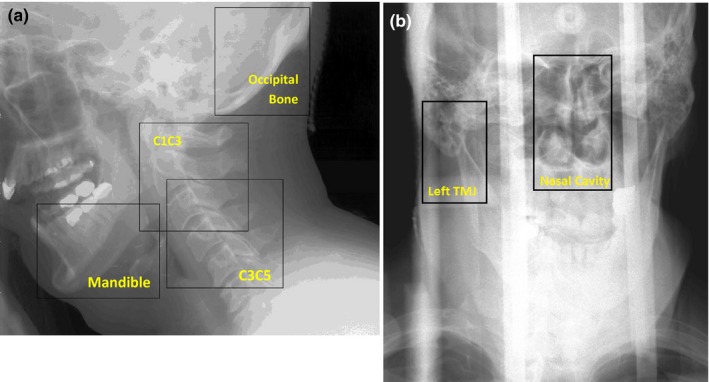
Histogram‐normalized kilovoltage image of a representative patient, outlining the subregions selected on the lateral image (a) and PA image (b) for registration. C1C3 and C3C5, cervical vertebrae 1–3 and 3–5, respectively.

Histogram‐normalized kilovoltage image of a representative patient, outlining the subregions selected on the lateral image (a) and PA image (b) for registration. C1C3 and C3C5, cervical vertebrae 1–3 and 3–5, respectively.