Figure 2.

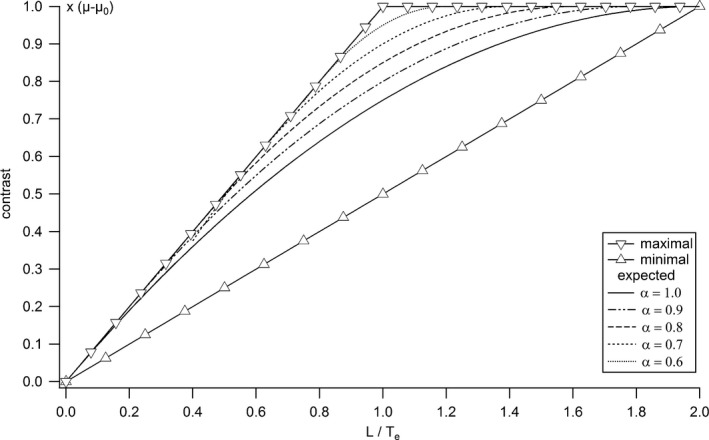
Maximal, minimal, and expected contrasts as functions of the ratio between object and slice thicknesses, calculated from the analytical model for different slice spacing.

Maximal, minimal, and expected contrasts as functions of the ratio between object and slice thicknesses, calculated from the analytical model for different slice spacing.