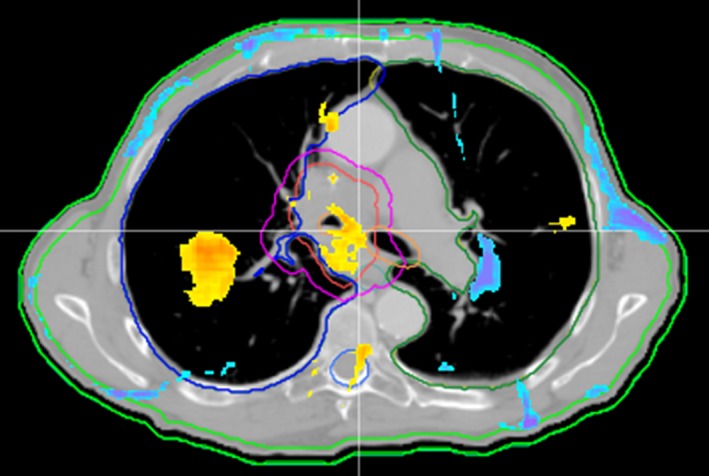
Figure 4.

Mobius vs. Eclipse AcurosXB gamma map for selected treatment plan. Mobius vs. Eclipse AcurosXB gamma map (3%, 2 mm) is shown for treatment plan 16. Yellow and blue areas represent high and low gamma failures, respectively. Note the typical areas of gamma failure at each beam entrance due to differences in the build‐up model, and heterogeneous areas in the lung and bone.
