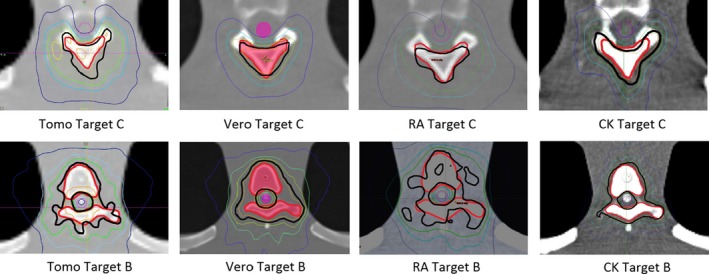
Figure 10.

Isodose distributions for Targets B and C (Red) and their relationship with the spinal cord (Purple). Isodose lines are as follows: 16.8 Gy Orange; 16.0 Gy Black; 14.4 Gy Green; 12.0 Gy Light Blue; 8.0 Gy Dark Blue.

Isodose distributions for Targets B and C (Red) and their relationship with the spinal cord (Purple). Isodose lines are as follows: 16.8 Gy Orange; 16.0 Gy Black; 14.4 Gy Green; 12.0 Gy Light Blue; 8.0 Gy Dark Blue.