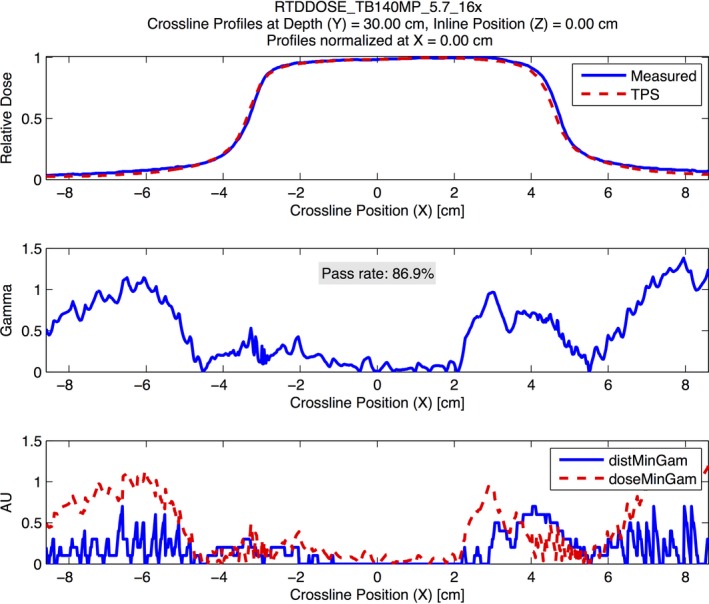
Figure 7.

An example demonstrating the modeling errors from Eclipse Acuros XB for the out‐of‐field dose at deeper depths. The figure shows a crossline profile at 30‐cm depth for a 16 MV photon beam for test 5.7. The analysis was performed using a 2% global/2 mm gamma analysis criterion. The figure demonstrates systematic underestimation of the out‐of‐field dose by Eclipse Acruos XB at deeper depths.
