
Figure 2.
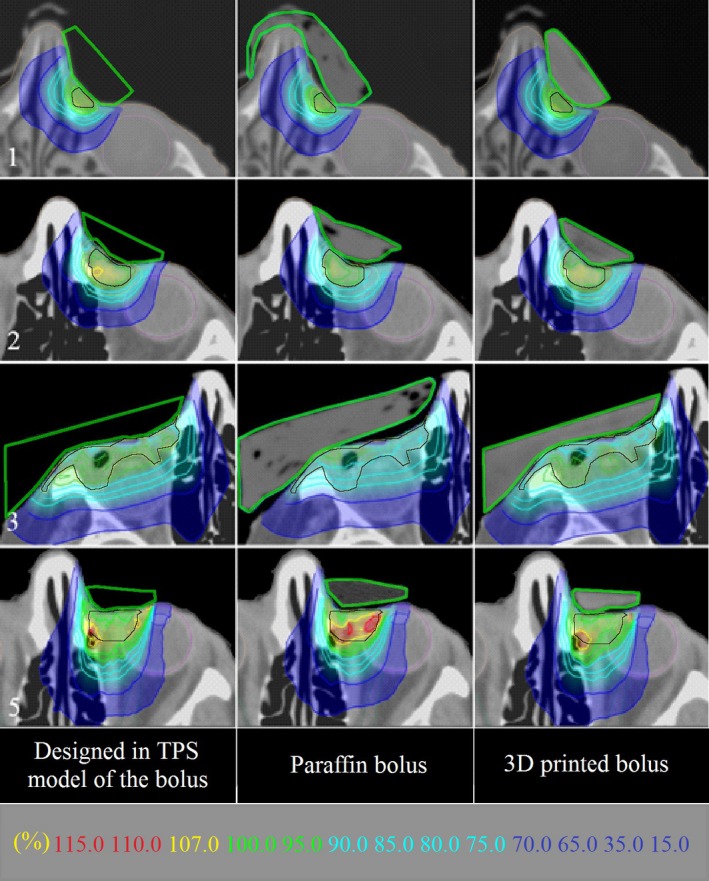
Comparison of dose distributions distal to reference model, paraffin, and 3D‐printed boluses and superimposed on transverse CT scans for select patients (1, 2, 3, 5). Bolus shapes are outlined in green. PTV is outlined in black. Note isodose values in key at bottom of figure.