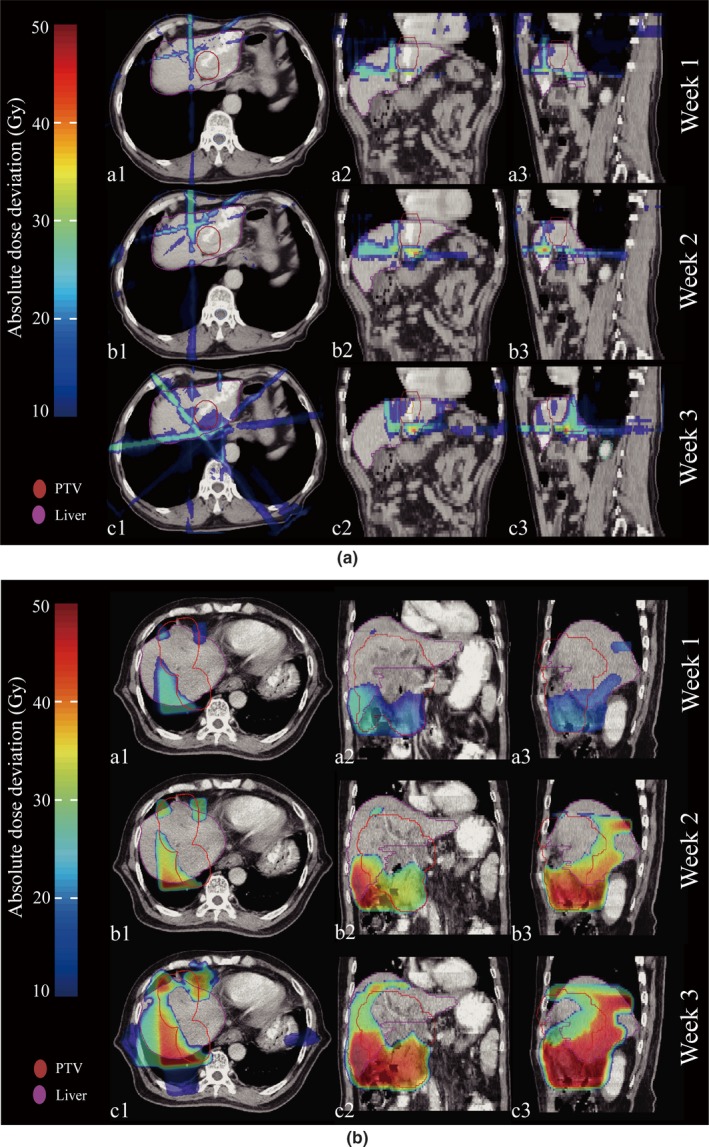
Figure 7.

Example of absolute dose deviation on pCT for patients without (a) and with (b) RILD. The dose deviation between pCT and mCBCT was shown in three different periods (top for week1, middle for week2 and bottom for week3), and a fractional reconstructed dose deviation from the planned dose (Dmcbct–Dplan) are shown in the transverse (a1, b1, and c1), coronal (a2, b2, and c2), and sagittal (a3, b3, and c3) views, respectively. Each mCBCT was deformed to the pCT for dose subtraction.
